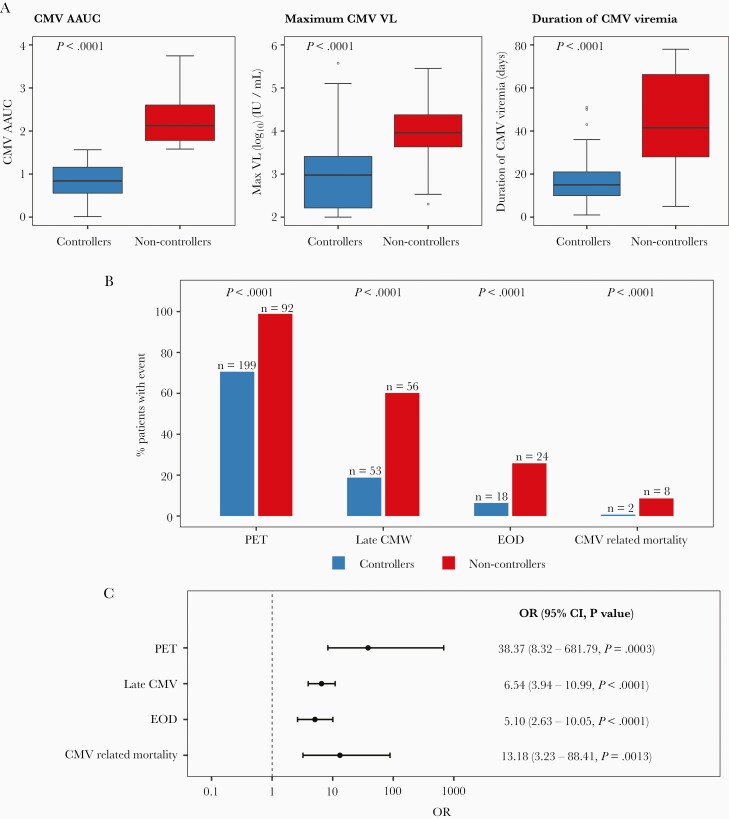
Figure 3.
Comparison of CMV kinetics and outcomes between CMV controllers (n = 282) and non-controllers (n = 93). CMV AAUC, maximum CMV VL, duration of CMV viremia, PET initiation by day 100, late CMV infection (occurring > day 100–180), CMV end-organ disease, and CMV-related mortality by 1-year post-HCT were compared between the 2 groups. All patients with CMV viremia by day 100 post-HCT were included (n = 375). A, Comparison of CMV viral kinetics by day 100. Horizontal lines represent median, boxes interquartile ranges, and whiskers range. P values were calculated with the Mann-Whitney U tests. B, Number (%) of CMV-related outcomes in CMV controllers and non-controllers. C, Unadjusted ORs (95% CI) for CMV outcomes in non-controllers (CMV controllers is the reference group). Abbreviations: AAUC, averaged area under the curve of CMV viral load; CI, confidence interval; CMV, cytomegalovirus; EOD, end-organ disease; HCT, hematopoietic cell transplant; OR, odds ratio; PET, preemptive therapy; VL, viral load.

