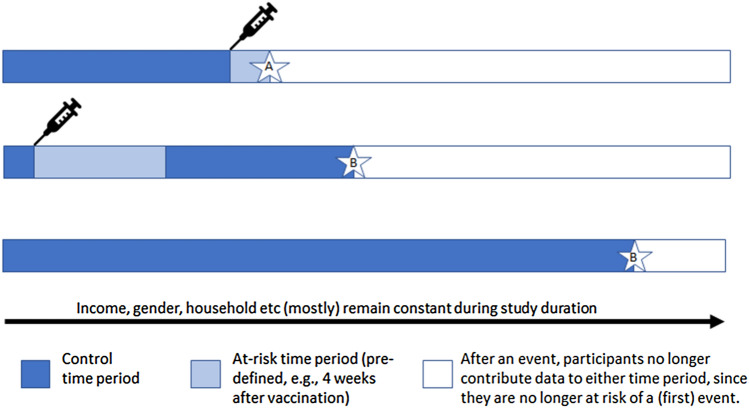
Fig. 1.
Self-controlled case series: example timelines of three participants. Averaged across all people in the study, the rate of events A occurring in the at-risk time period is compared to the rate of events B in the control time period. Many factors which in other designs could be confounders are assumed to be constant within each person across their duration of participation. Only those who have experienced an event are included as cases

