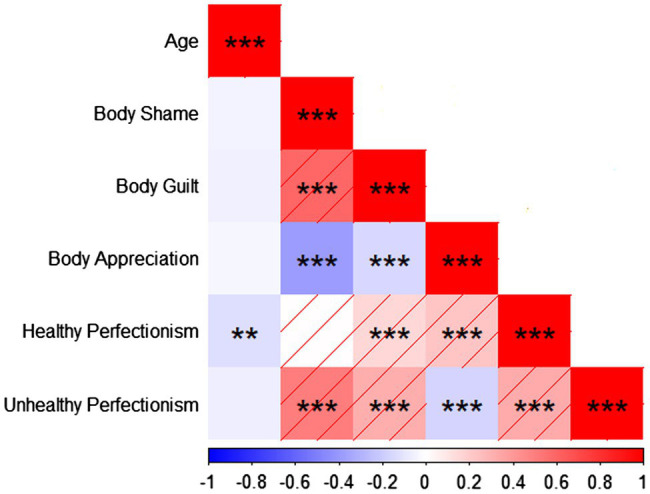
Figure 1.

The red shade indicates a positive correlation. The red color represents a significantly positive correlation; the blue color represents a significantly negative correlation. **p < 0.01; ***p < 0.001. The horizontal axis represents the correlation coefficient in the ± 1.
