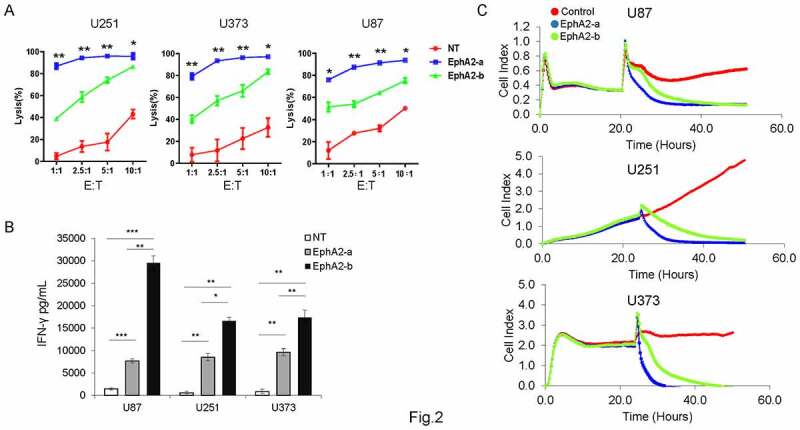
Figure 2.

Comparison of antitumor effects of different EphA2 CAR-T cells In vitro. NT or EphA2 CAR-T cells were co-cultured with different target cells at different E:T ratios (1:1, 2.5:1, 5:1, and 10:1) for 24 h. (a) The cell lysis rate was quantified by examining the luciferase activity. (b) The supernatants were collected to evaluate IFN-γ levels by ELISA (E:T = 10:1). (c) Continuous graphical output of cell index values up to the 50 h time point was monitored using the xCELLigence impedance system. Results were analyzed by one-way ANOVA, and statistical significance was set at *p < .05, **P < .01, ***p < .001
