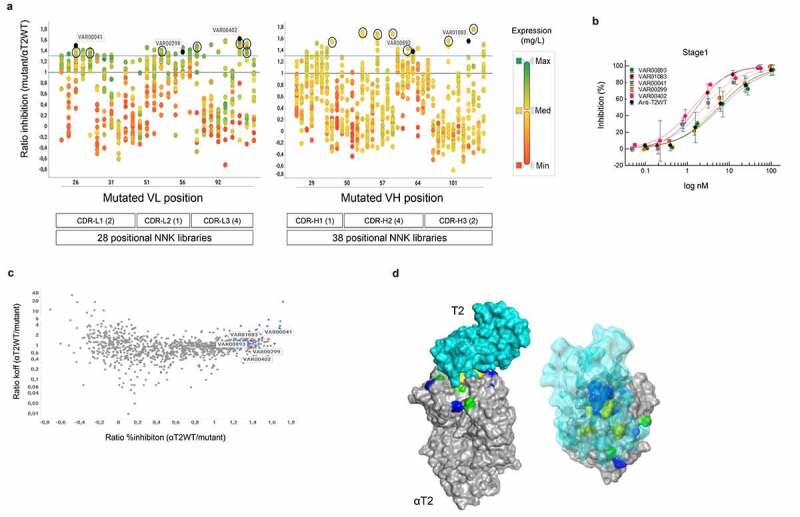
Figure 4.

Compartmentalized positional Fab library screening. a) Expression activity correlation. 66 positional-NNK libraries (representing 28 variable light chain (VL) domain and 38 variable heavy chain (VH) domain libraries) addressing all complementarity-determining region (CDR) positions of the His-tagged anti-T2WT Fab were deconvoluted into their single amino acid substitutions using the same workflow as described for CODV-Igs in Figure 1 and Supplementary Figure 2. 1,054 of 1,254 potential variants (pre-registered as DMOLS) arising out of 19 alternative amino acid substitutions for all 66 CDR positions could be recovered. Individual substitutions that correspond to distinct CDRL1-L3 or CDRH1-H3 positions are represented by vertically aligned dots. CDR definition according to Kabat scheme slightly modified as described by Votsmeier et al.25 HEK293 expression supernatants of the single NNK Fab variants were quantified by anti-His detection using BLI technology and then analyzed in cell-based HTRF reporter gene assays to inhibit T2-dependent STAT protein phosphorylation. The expression quantification results are represented by different colors. Expression ratios relative to the quantified His-tagged anti-T2WT Fab construct are shown by a color gradient from low (red; VL & VH: Min (Minimum) = 0.04), medium (yellow; VL Med (Median) = 1.38, VH Med = 1.14) to high (green; VL Max (Maximum) = 2.61, VH Max = 3.74). Activity ratios of the corresponding mutants relative to the wildtype calculated from STAT protein phosphorylation inhibition in THP-1 cells after T2 stimulation in HTRF assay (single dose measurements) are displayed on the y-axis. The solid blue line represents the ratio of 1.3. Distinct CDR variants (VAR) marked in dark blue are representatives of full dose response measurements (Figure 4b). Black circles indicate highly active variants that were selected for recombination in the αT2-Fab scaffold (see below Figure 5). Ratios ≤0 depict variants with no measurable STAT protein phosphorylation inhibition. b) Dose response curves of STAT protein phosphorylation inhibition in THP-1 cells after T2 stimulation by selected Fab mutants. Supernatants containing the expressed Fab mutants were serially diluted and tested as described in materials and methods. Low control, containing only THP-1 cells without T2 stimulation is defined as 100% inhibition and high control with T2 stimulation as 0% inhibition. Averages of duplicate measurements are shown in the plot. Standard deviations are represented as error bars. Note that increased activity levels seen in a) correlated well with decreased 50% inhibitory concentrations (IC50). For example, variants exhibiting over 150% of the wild activity (VAR00402 or VAR01083) also showed a more than 5-fold decrease of the corresponding wild type IC50 values. c) Affinity potency correlation. Activity ratios of 1,054 individual Fab variants were plotted against the dissociation rate constants (koff) quotient from the anti-T2WT Fab and the individual variants as measured by BLI (antigen capture mode) with increased ratios indicating reduced off-rates. The 56 variants which displayed greater 130% activity are marked in blue. Five variants for which full dose responses have been determined are indicated in red. Note that slower off-rates (indicative of improved affinities) often did not correlate with increased activities. d) Structural analysis. Positional library screening yielded a comprehensive and multi-dimensional data set that constitutes a basis to deeper explore structure-function relationships of the αT2 binder. As an application example, a solid surface representation of a crystallographic structure of the anti-T2WT Fab fragment (gray) in complex with T2 (a. turquoise – solid surface; b. turquoise – transparent surface) was generated. CDR positions for which substitutions were found that: 1) significantly increase potency and affinity are shown in green; 2) increase affinity only are colored yellow; 3) increase potency only are depicted in blue. Note that many potency-improving residues are located outside the paratope-epitope interaction interface
