
Figure 5.
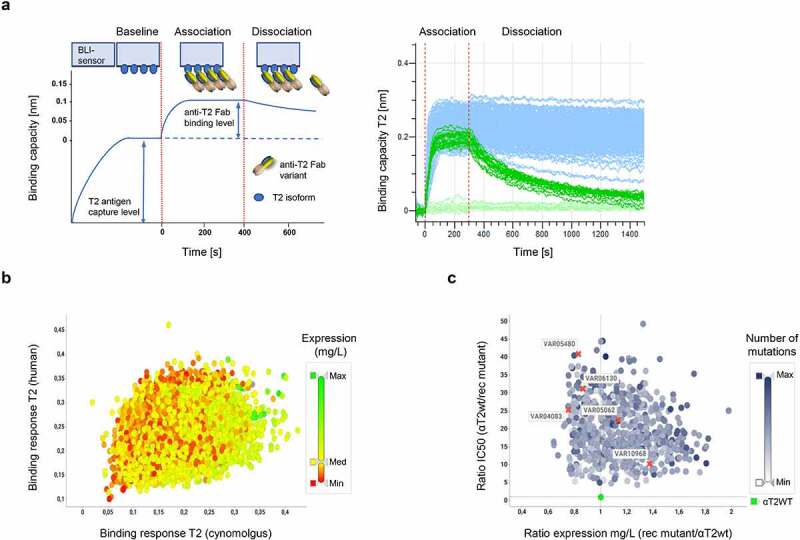
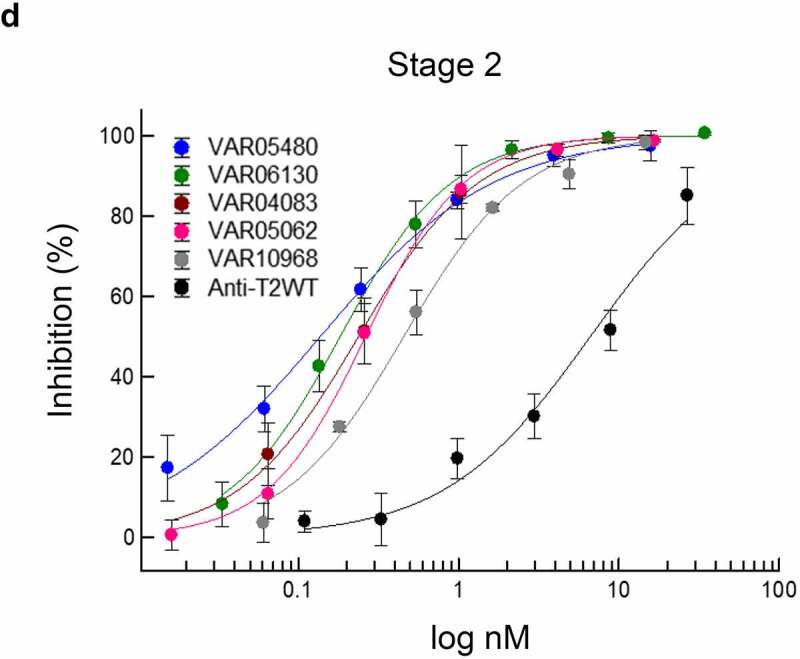
Compartmentalized recombination Fab library screening. a, b) Species cross-reactivity. a) To safeguard that recombination mutants which carry potency-improving substitutions against the human isoform of T2 are still cross-reactive against the cynomolgus T2 isoform, all 12,288 expression supernatants were quantified and then analyzed for their binding capacities against human and cynomolgus T2 isoforms using BLI technology in an antigen capture format.26 Here, the signal increase of the binding curve over baseline after addition of normalized samples to BLI sensors decorated with captured T2 antigen was measured as wavelength shift [nm]. The spectral shift is indicative for the binding capacity of the analyzed variant as schematically represented on the left. An aggregated view of 384 exemplary binding curves is depicted on the right. Note the increased binding capacities and reduced dissociation rates of many anti-T2WT Fab recombination variants (light blue curves) when compared to anti-T2WT Fab curves (light green; 16 replicates). b) Representation of 4,294 recombination mutants selected from 12,288 combinatorial variants. Only potency-improved variants were selected that displayed equal or better signal increases to human T2 (>0.1 nm) and cynomolgus T2 (>0.05 nm) when compared to the anti-T2WT Fab while expressing at titers >100 mg/L. Expression as determined by anti-His detection using BLI technology is shown by a color gradient from low (red; Min ≤ 0.1 mg/L), medium (yellow; Med = 150 mg/L) to high (green; Max = 750 mg/L). c) Expression activity correlation. Of the 4,294 variants which had been verified to be cross-reactive, 443 rec mutants with significantly increased activities as determined in single dose experiments (SSupplementary Figure 5b) were subjected to full dose response measurements. Activity ratios of the 443 variants were plotted against the expression rate quotient from the anti-T2WT Fab and the individual variants. The number of mutations that variants carry is shown by a color gradient from low (white; Min = 1 mutation) to high (blue; Max = 11 mutations). The anti-T2WT Fab is marked in green. Variants, for which full dose response curves are depicted in d) are indicated by a red cross and respective VAR identifiers. No correlations were found between expression levels, IC50 values and number of mutations. d) Dose response curves of STAT protein phosphorylation inhibition in THP-1 cells after T2 stimulation by selected Fab recombination mutants. Assay description as detailed in Figure 4b. Recombination of potency improving single substitutions leads to further activity improvements
Figure 5.
(Continued)