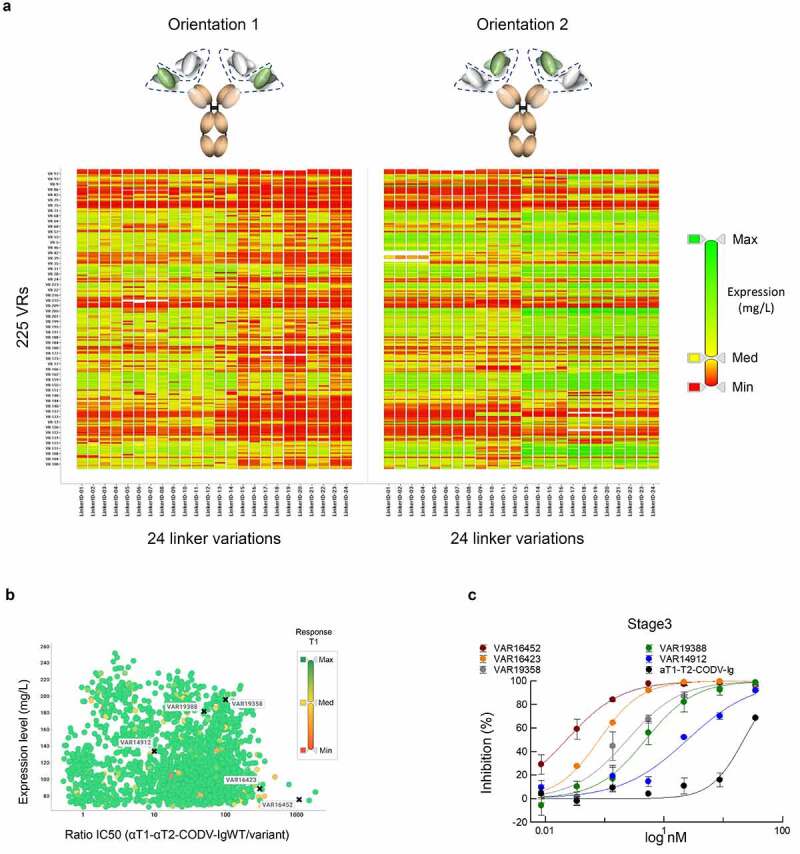
Figure 6.

Compartmentalized CODV-Ig library screening. a) Impact of CODV-Ig design on expression. Graphical representation of expression values across 10,538 CODV-Ig variants. Individual tiles represent the different CODV-Ig designs with 225 optimized VRs corresponding to the rows of the matrix and 24 linker configurations corresponding to the columns. The two CODV-Ig orientations are shown separately. Individual expression values contained in tiles of the grid are scaled by a color gradient from low (red; Min ≤ 0.1 mg/L), medium (yellow; Med = 29 mg/L) to high (green; Max = 233 mg/L). Note that linker variegations can lead to significantly improved expression titers for same VR combinations in different orientations indicating that expression titers can be optimized by structural adaptations. b) Expression activity correlation. Full dose response measurements of STAT protein phosphorylation inhibition in THP-1 cells after T2 stimulation by 1,621 CODV-Ig variants selected based on expression (>75 mg/L). Activity ratios of the corresponding 1,621 variants relative to the prototypic αT1-αT2-CODV-Ig (Orientation 2) were plotted against the expression rate (mg/L). Binding capacities against T1 were confirmed by BLI in an antigen capture format. Binding response ratios of the variants relative to the prototypic αT1-αT2-CODV-Ig (Orientation 2) are shown by a color gradient from low (red; Min = 0.04), medium (yellow; Med = 0.52) to high (green; Max ≥ 1). Note that the vast majority of CODV-Ig variants displayed binding capacities against T1 similar to the αT1-αT2-CODV-Ig starting variant. Variants, for which full dose response curves are depicted in c) are indicated by a black cross and respective VAR identifiers. Note that accommodation of optimized VRs in CODV-Ig format led to the identification of variants showing up to 1,000-fold improved activities. c) Dose response curves of STAT protein phosphorylation inhibition in THP-1 cells after T2 stimulation by selected CODV-Ig variants. Assay description as detailed in Figure 4b
