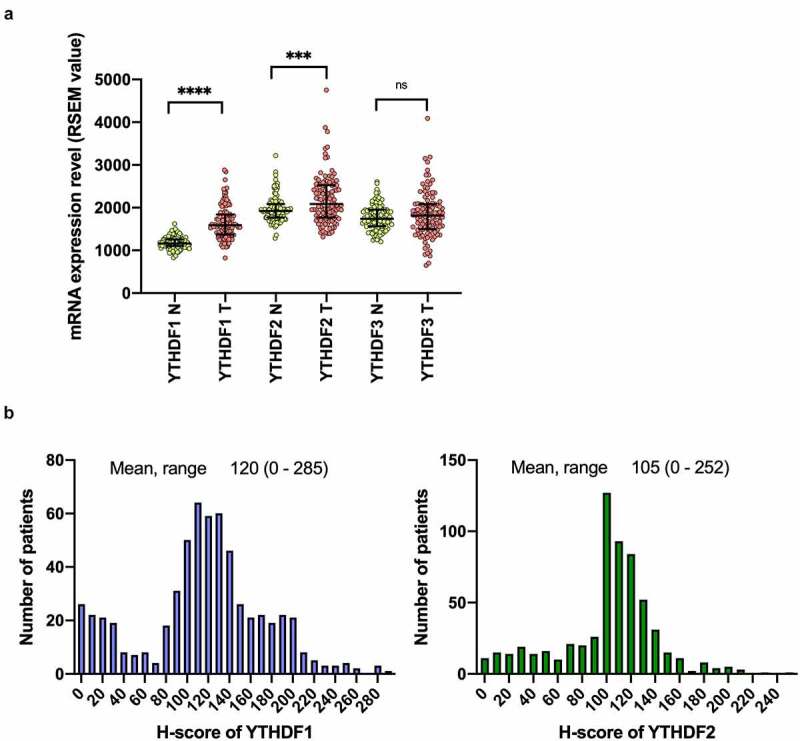
Figure 2.

Level of YTHDF1 and YTHDF2 expression is elevated in NSCLC
(a) Comparison of the expressions of YTHDF 1, YTHDF2, and YTHDF3 in tumor and nontumor lung tissue in patients with non–small-cell lung cancer (N: nontumor tissue, T: tumor tissue). ***P < .001 and ****P < .0001, Mann–Whitney U test). Results were presented as means ± SD. (b) The histograms show the distribution of the H-scores for YTHDF1 and YTHDF2 evaluated by immunohistochemistry.
