Figure 6.

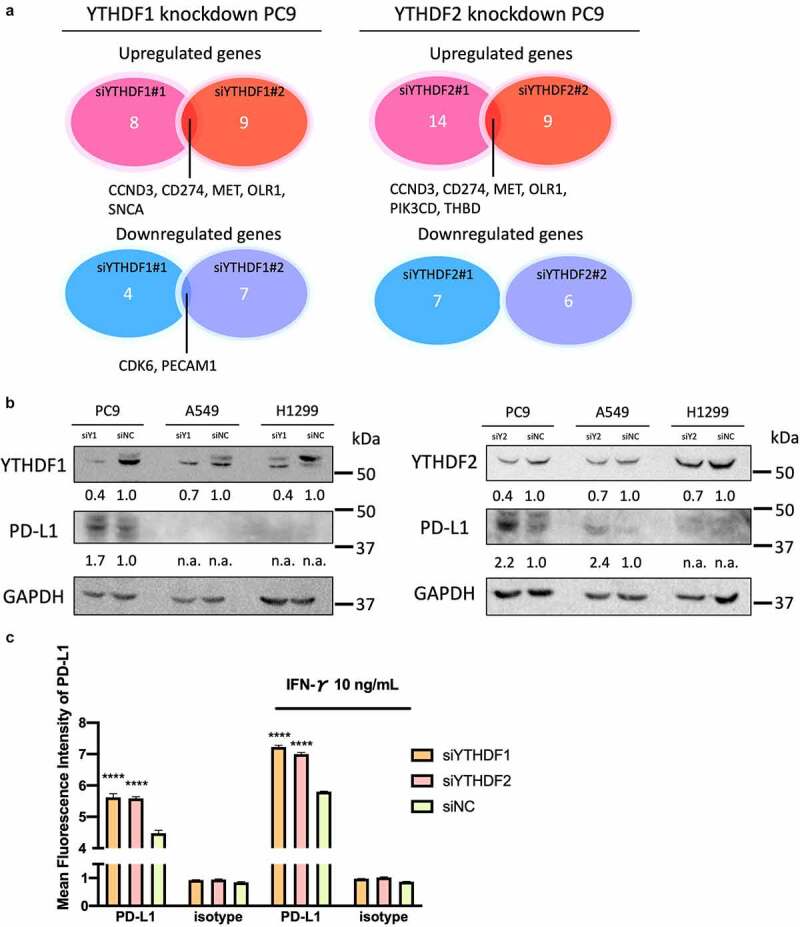
YTHDF1 and YTHDF2 knockdown increased tumoral PD-L1 expression in lung cancer cells
(a) Venn diagram indicating the number of common genes in different sequences of siRNA at least 2.0-fold alteration of RNA expression (n = 1). (b) Representative immunoblot analysis of YTHDF1 and YTHDF knockdown lung cancer cells. The protein expression of YTHDF1 or YTHDF2 and PD-L1 and GAPDH were shown. The score below the photo is a quantification of the relative intensity of the PD-L1 band to GAPDH. (c) PD-L1 cell surface expression in PC9 cells with YTHDF1 or YTHDF2 knockdown with or without interferon-γ stimulation determined by flow cytometric analysis (n = 3 per group, ****P < .0001, Student’s t test). Results were presented as means ± SD.
