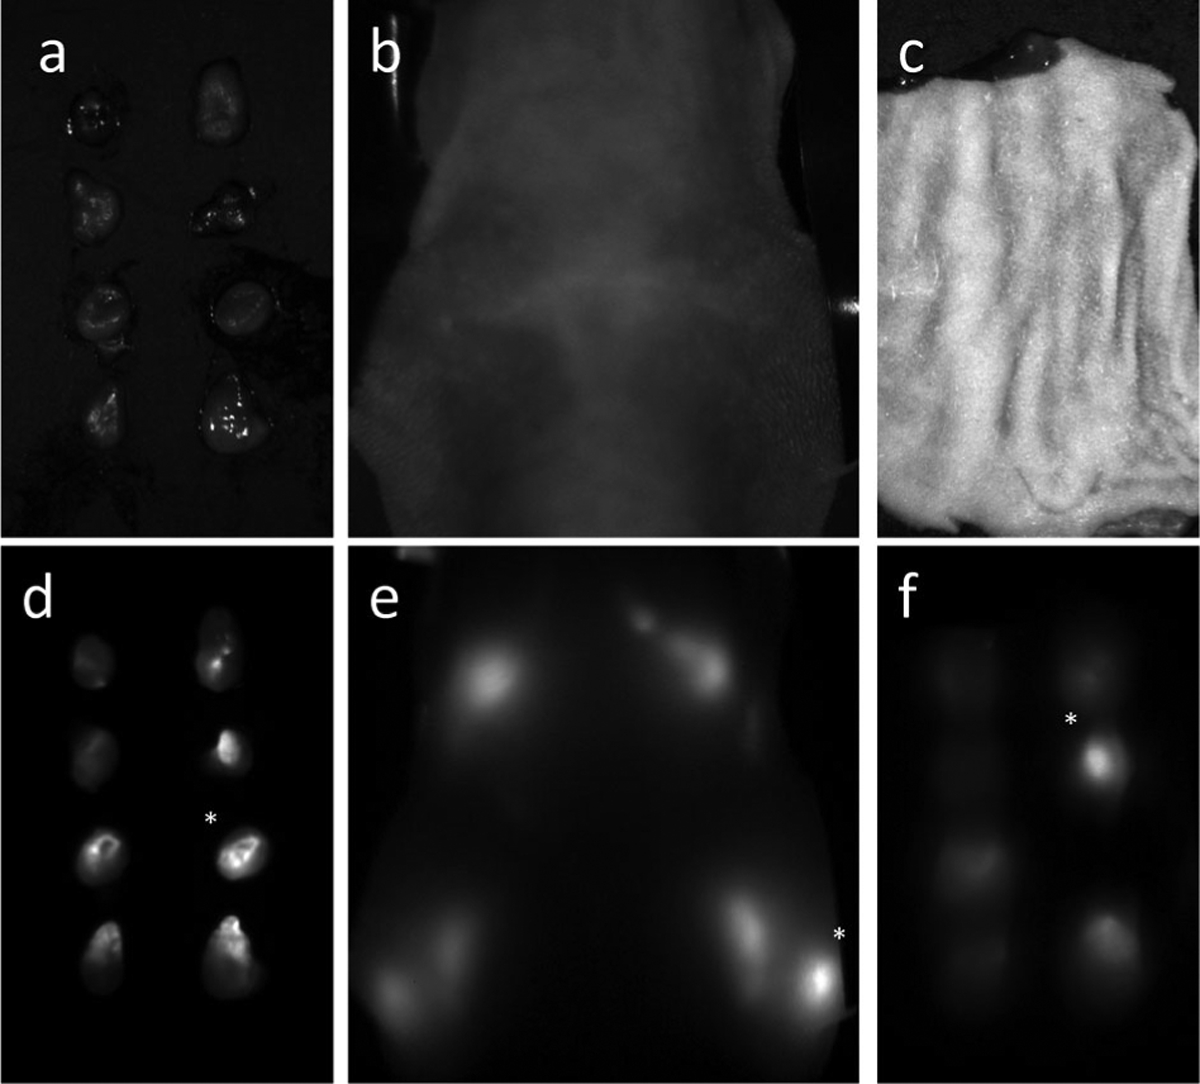
Figure 2.

Relative fluorescence intensities of the lymph nodes in each image [ex vivo (a, d; white light and fluorescence images), in vivo with deep red (b, e), red, yellow, green and blue excitation, ex vivo with skin covering with deep red (c, f), red, yellow, green and blue excitation] were calculated relative to the standard node, which was set as the brightest node for each mouse in the ex vivo image. The ex vivo relative intensities (Sn) were used as the gold standards and the quantization error (En) in fluorescence intensity (In) was calculated relative to those intensities (En = |(Sn − In)/Sn| for each n, or lymph node).
