
Fig. 3.
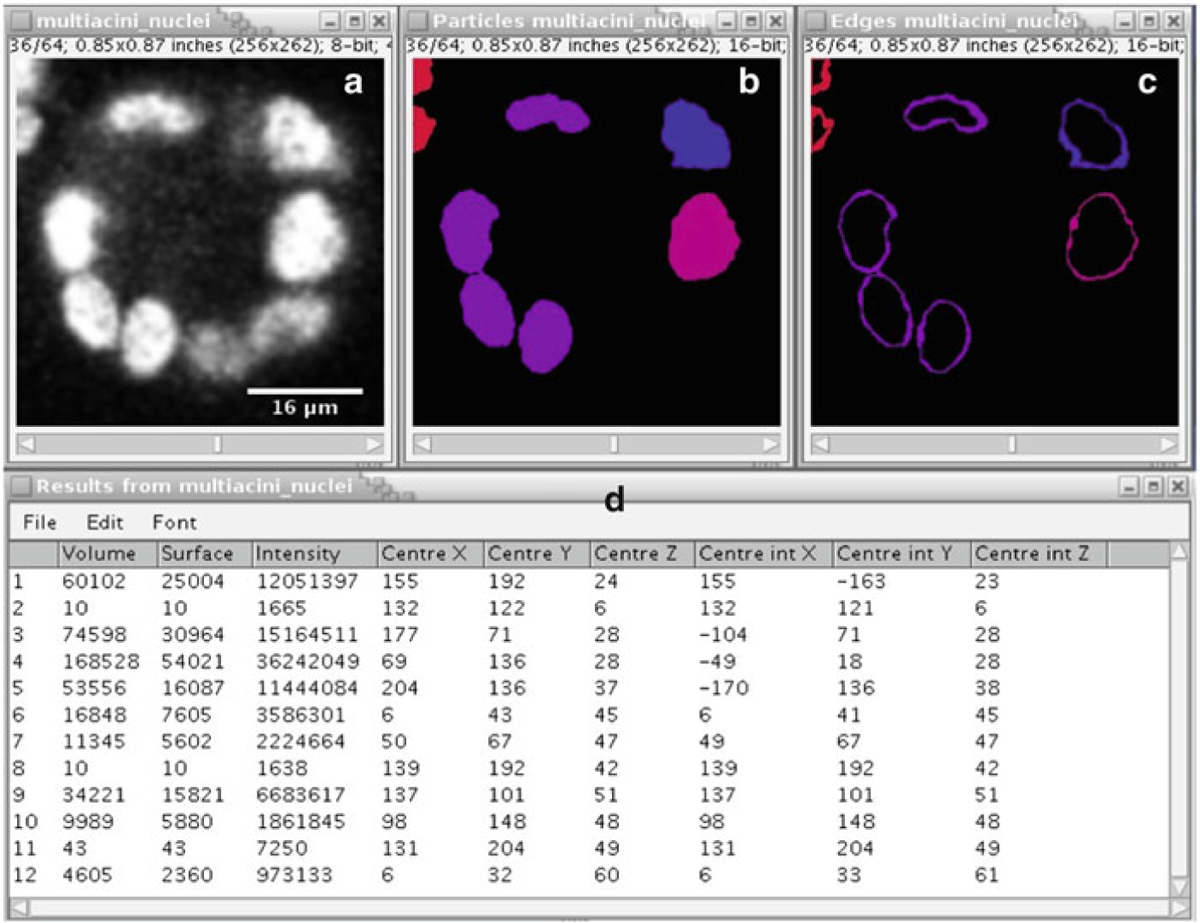
ImageJ output. (a) Original slice from the MCF-10A sample. (b) Detected objects shown in slice 36 using the 3D Object Counter plugin. (c) Edge delineation of the detected samples. (d) Object log showing various statistics obtained from the 3D Object Counter