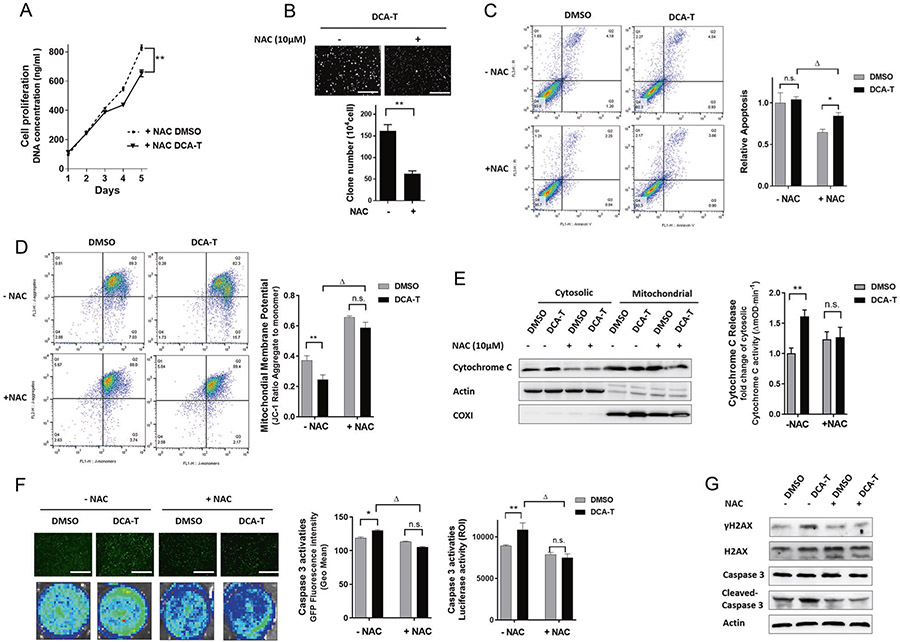
Fig. 4.
ROS production is linked with “Minority MOMP.” a Cell proliferation was measured by the CyQuant assay (**P < 0.01). b The colonies in soft agar were photographed and counted (mean ± SD) in DCA-T cells with or without NAC (**P < 0.01). c Cells were stained with annexin V and PI and analyzed by FACS. Cells positive for annexin V staining were counted as apoptotic cells (*P < 0.05 for DMSO versus NAC; ΔP < 0.05 for DCA-T without NAC). d Analysis of ΔΨm using flow cytometry with JC-1 dye. Loss of ΔΨm was shown as a ratio (**P < 0.01 as compare with DMSO, ΔP < 0.05 as compare with DCA-T without NAC treatment). e After NAC treatment, immunoblots for cytoC were performed on mitochondrial and cytosolic fractions. The ELISA assay showing activities of cytoC in cytosolic fractions. f Cells with caspase 3 reporter were treated with NAC, ABT-737 (10 μM), or MG132 (10 μM). The growth of cells as observed by the EGFP activity. Representative images from florescence imaging, original magnification ×40, scale bar = 125 μm. (*P < 0.05, **P < 0.01 as compare with DMSO groups, ΔP < 0.05 as compare with DCA-T without NAC treatment). g The protein levels of γH2AX, Caspase 3, and cleaved-caspase 3 were analyzed by immunoblots

