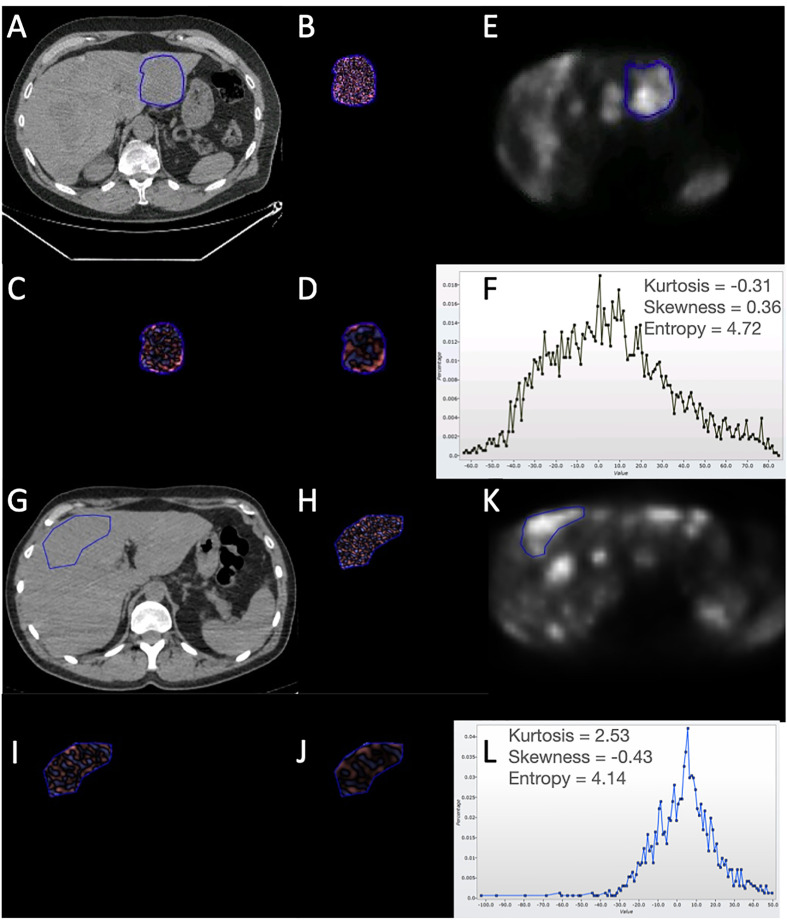
Figure 1.
Illustration of the filtration-histogram-based texture analysis as applied on an individual liver lesion for two patients with NET on 68Ga-DOTATATE PET/CT. Top patient had a better response/outcome (PFS=30 months and OS=50 months) compared to the bottom patient (PFS=1 month and OS=6 months) to 177Lu-DOTATATE. (A, G) highlight the conventional CT image with the tumor encircled for the two patients, followed by corresponding (B, H), which highlight the fine-texture map; (C, I) highlight the medium-texture map; (D, J) highlight the coarse-texture map; (E, K) highlight the PET image with the tumor encircled; and (F, L) highlight the histogram distribution along with the texture features (kurtosis, skewness, and entropy) for the coarse-texture map on CT (as an example). For the texture maps: Pink reflects positive filtered pixel intensity values, i.e., bright areas (the more intense the color, the brighter the area); blue reflects negative filtered pixel intensity values, i.e., dark areas (the more intense the color, the darker the area). For the PET-image: Brighter areas reflect increased avidity.

