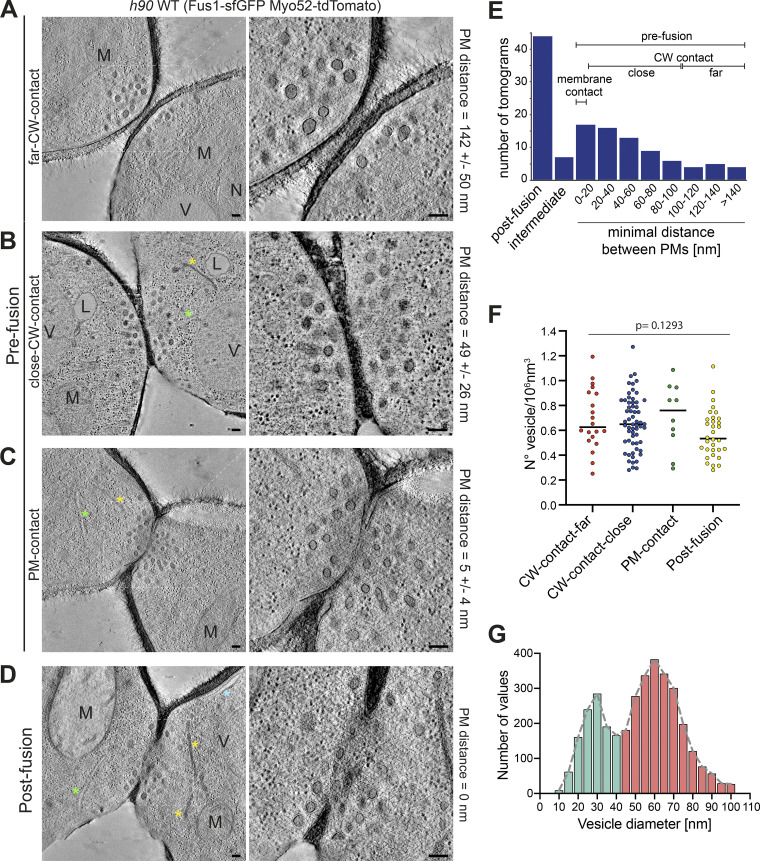
Figure 1.
Correlative light-electron analysis of the yeast fusion site. (A–D) Virtual z-slices through tomograms of cell pairs during mating as identified by LM (see Fig. S1). Examples of different stages: far CW contact (A), close CW contact (B), PM contact (C), and after fusion (D). (E) Tomogram distribution according to minimal distance between PMs. (F) Vesicle density (n = 20 cells in far CW contact; n = 60 CW contact close; n = 10 PM contact; n = 32 after fusion, including 8 with local loss of CW density). P = 0.1293 (one-way ANOVA test). (G) Vesicle size distribution in cells as in F (n = 122 cells and 3,521 vesicles). Bin width = 5 nm. Blue asterisk = cortical smooth ER; green asterisk = rough ER; yellow asterisk = dense sheet or reticulated organelle; M = mitochondrion; V = vacuole; L = lipid droplet; N = nucleus. Scale bars, 100 nm.

