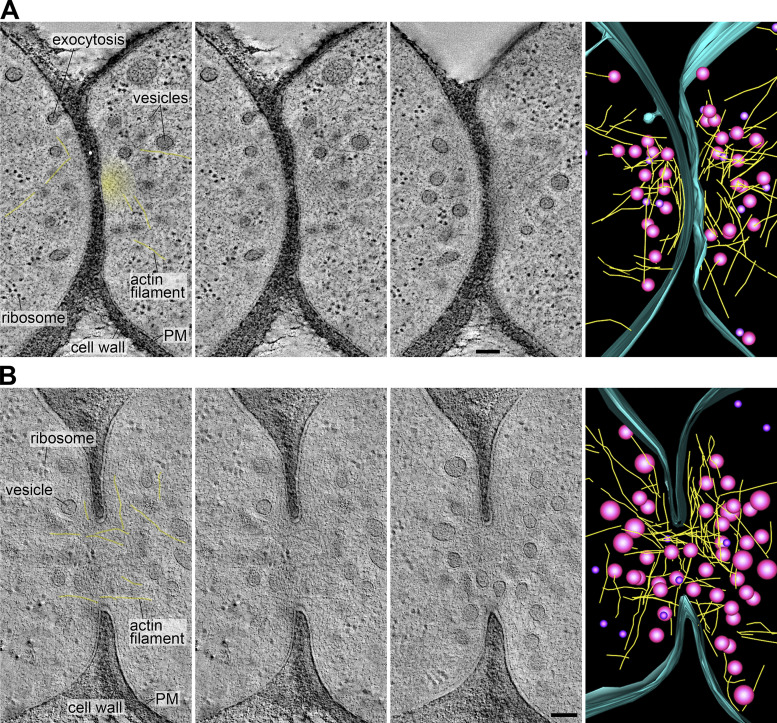
Figure 2.
Actin fusion focus ultrastructure. (A and B) Virtual z-slices through tomograms and model of the fusion focus including vesicles (magenta), actin filaments (yellow), and the PM outer leaflet (blue) in cell pairs before (A) and after fusion (B). The first two images are identical, with and without labels. Yellow lines overlay the clearest actin filaments. The yellow haze in the top pair highlights a region likely dense with actin filaments that cannot be individually resolved.. Scale bars, 100 nm.

