Figure 7.
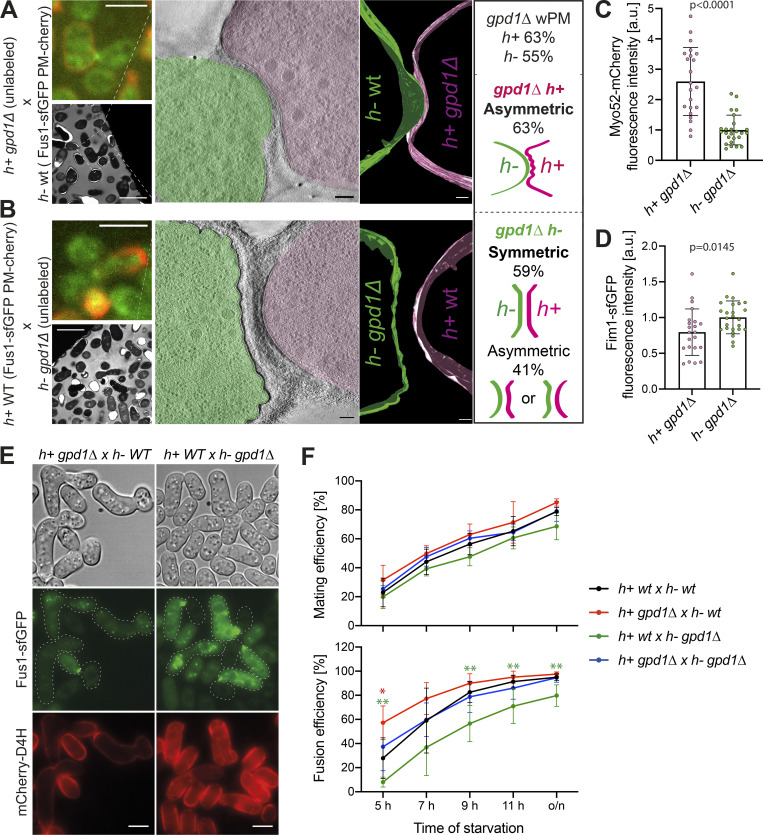
Different turgor pressure between cells of a pair is required for fusion. (A and B) Representative example of h− WT cells crossed with h+ gpd1Δ cells. The top left LM pictures show Fus1-sfGFP (green) and mCherry-D4H (red) expressed in the WT cell. The bottom left TEM pictures show the same mating pair. The virtual tomogram slices show PM shapes, segmented with Imod. Scale bars are 5 µm in LM, 10 µm in TEM, and 100 nm in tomogram slices. (C and D) Myo52-mCherry and Fim1-sfGFP mean fluorescence intensities of the 5 maximum pixels around each peak from shmoo tip profiles of tagged gpd1Δ cells crossed to WT imaged as in Fig. 6, E and F (n = 22 h+, 25 h− gpd1Δ cells from two experiments; P values are from Mann–Whitney tests). (E) LM images of WT × gpd1Δ crosses at 7 h of nitrogen starvation. Fus1-sfGFP (green) and mCherry-D4H (red) are present only in WT cells. gpd1Δ cells are unlabeled. (F) Mating and fusion efficiencies over time (n ≥ 900 cells of each genotype from five to seven experiments; *, P < 0.05; **, P < 0.01 from unpaired t tests).

