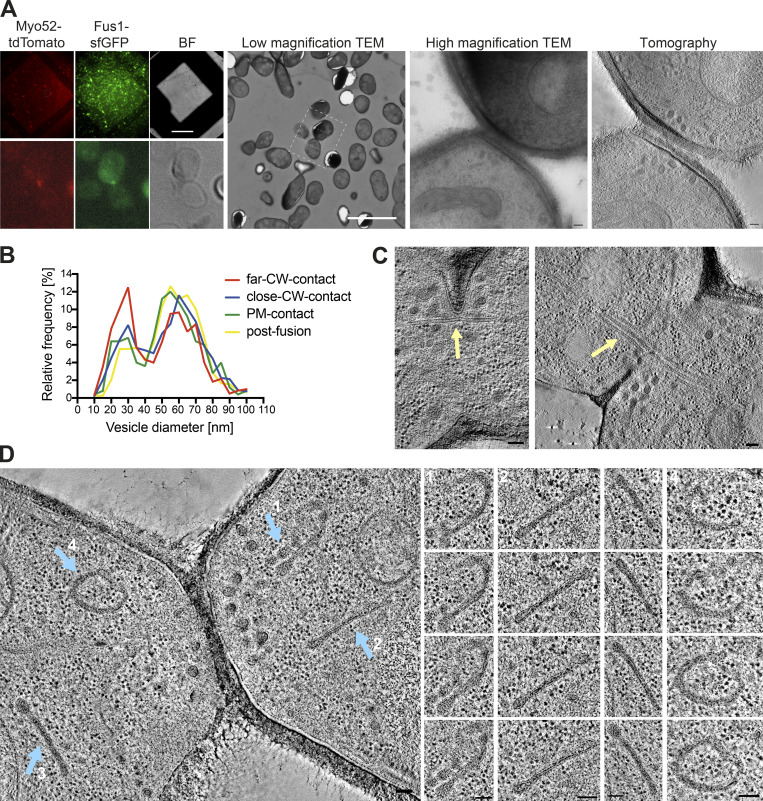
Figure S1.
Examples of CLEM and ultrastructural features during mating. (A) LM images are GFP and tdTomato signals on 300-nm sections of resin-embedded yeast cells expressing Fus1-GFP and Myo52-tdTomato, placed on EM grids. Scale bar is 45 µm. Cells with fusion focus fluorescence signal are identified in low magnification (17.816-nm pixel size) TEM according to their position, preservation is tested at high magnification (1.205-nm pixel size) TEM, and tilt series are acquired at this same magnification and processed for tomographic 3D reconstruction. Scale bars are 10 µm in low magnification TEM and 100 nm in high magnification TEM and virtual z-slice through tomogram. BF, brightfield. (B) Size distribution of vesicles separated in the four stages: far CW contact (n = 20 cells; 616 vesicles), CW contact close (n = 60 cells; 1,865 vesicles), PM contact (n = 10 cells; 252 vesicles), and after fusion (n = 16; 788 vesicles). Bin width = 5 nm. (C and D) Virtual z-slices through electron tomograms of mating cells showing microtubule bundles crossing the fusion pore (C, yellow arrow) and organelles with similar density to secretory vesicles, organized in sheets or reticulated structures (D, blue arrows). Scale bars for EM images, 100 nm.

