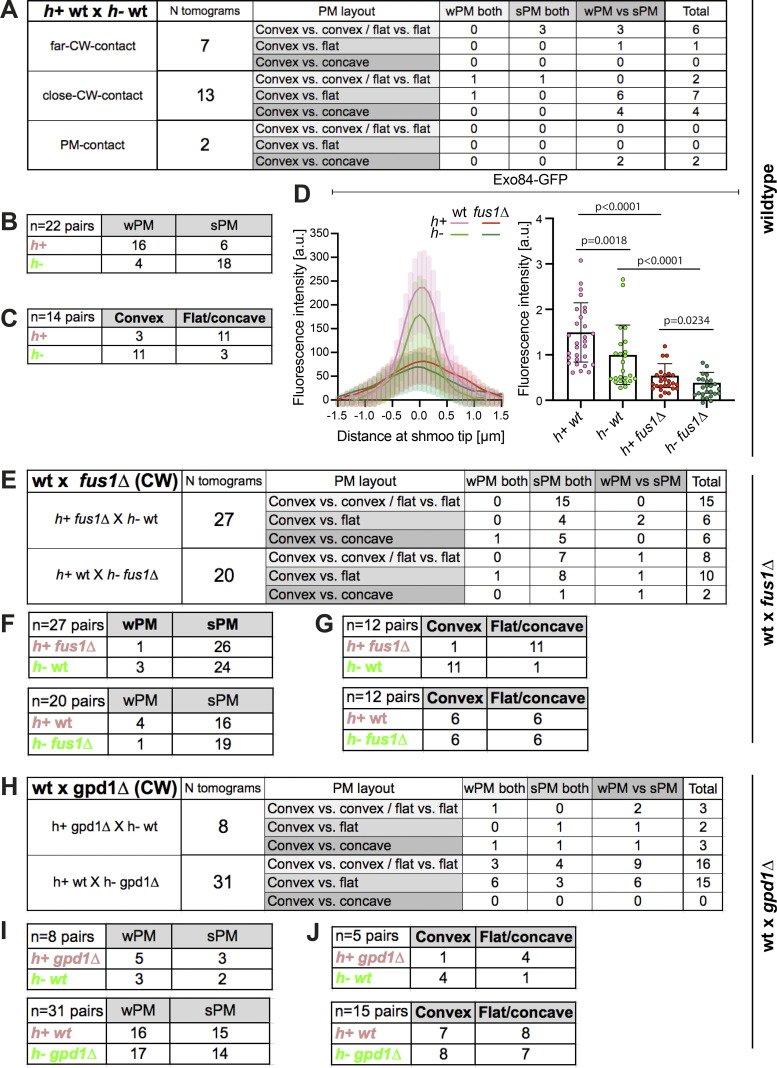
Figure S4.
Classification of tomograms from heterothallic crosses and additional data on distribution of exocytic vesicles. (A) Table classifying the set of tomograms from WT h+ × h− cell pairs used in this study, according to PM morphology. (B) Table showing the number of each mating type in WT h+ × h− crosses with wPM or sPM. (C) Table showing, among asymmetric WT mating pairs, the number of each mating type with convex or flat/concave shmoo tip conformation. (D) Left: Fluorescence profile of Exo84 (GFP) along the shmoo tips of labeled WT and fus1Δ cells crossed to unlabeled WT cells. Images were obtained from average projections of time-lapse videos acquired at a maximum speed during 3 min (n = 16 h+ WT cells, 13 h− WT cells, 15 h+ fus1Δ cells, and 14 h− fus1Δ cells). Right: Exo84 mean fluorescence intensity of the 5 maximum pixels around peak from profiles as on the left (n = 29 h+ WT cells, 24 h− WT cells, 26 h+ fus1Δ cells and 25 h− fus1Δ cells from two experiments; P values from Mann–Whitney tests). (E) Table classifying the set of tomograms from WT × fus1Δ crosses used in this study, according to PM morphology in the CW contact stage. (F) Tables showing the number of each mating type in WT × fus1Δ crosses with wPM or sPM. (G) Tables showing, among asymmetric WT × fus1Δ mating pairs, the number of each mating type with convex or flat/concave shmoo tip conformation. (H) Table classifying the set of tomograms from WT × gpd1Δ crosses used in this study, according to PM morphology in the CW contact stage. (I) Tables showing the number of each mating type in WT × gpd1Δ crosses with wPM or sPM. (J) Tables showing, among WT × gpd1Δ asymmetric mating pairs, the number of each mating type with convex or flat/concave shmoo tip conformation.

