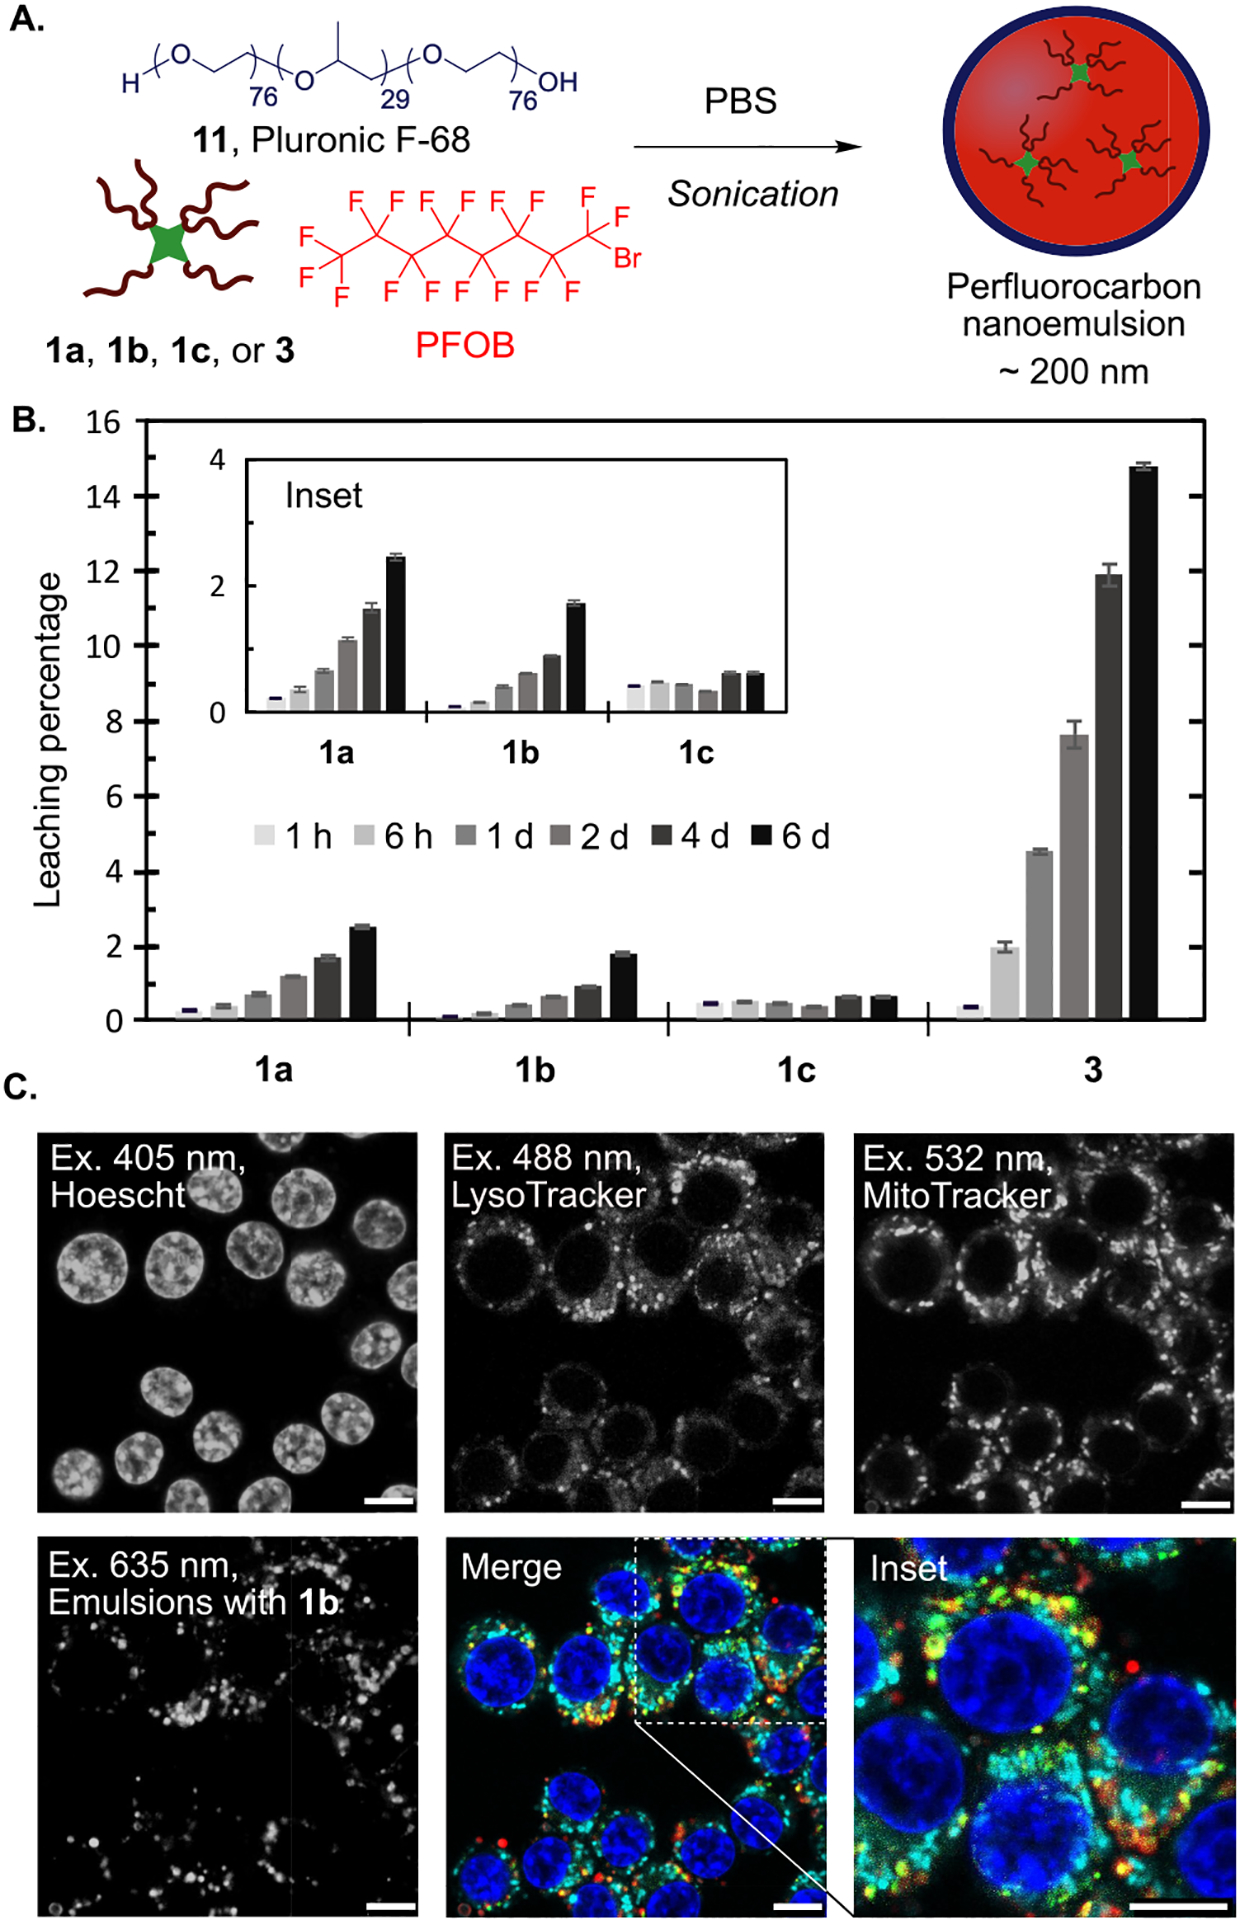
Figure 4.

(A) Nanoemulsion preparation entails sonication of PFOB with a fluorofluorophore and Pluronic F-68 in phosphate buffered saline (PBS). (B) The leaching of fluorofluorophores 1a–1c and 3 from PFC nanoemulsions is assayed by rocking an aqueous solution of PFC nanoemulsions containing 0.6 mM fluorofluorophore against 1-octanol. The fluorescence of the 1-octanol layer at 1 h, 6 h, 1 d, 2 d, 4 d, and 6 d is represented as a percentage of total fluorescence in control leaching experiments. (C) Microscopy images of RAW264.7 cells treated with nanoemulsions containing 1b for 3 h. After treatment, cells were washed and replaced with OptiMEM containing cellular stains. The emulsions containing 1b (red, ex 635 nm, collect 640–800 nm) are imaged alongside with LysoTracker (green, ex 488 nm, collect 500–530 nm), MitoTracker (cyan, ex 532 nm, collect 540–600 nm), and Hoechst dye (blue, ex 405 nm, collect 420–460 nm). Scale bar = 7.5 μm.
