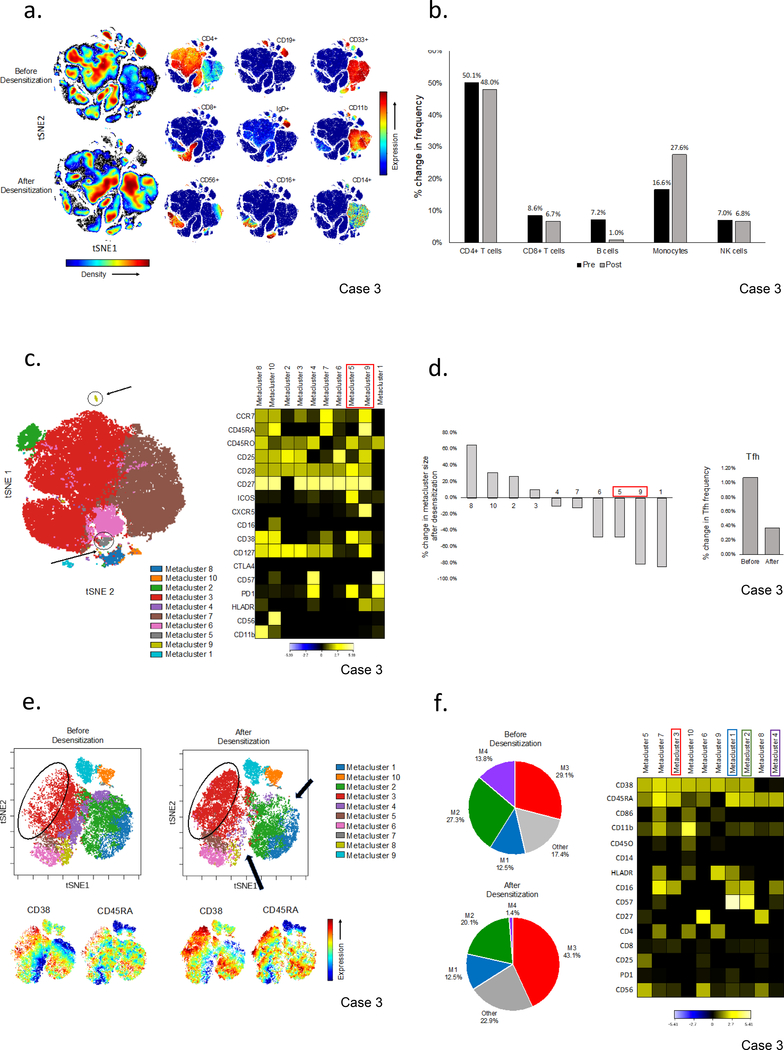
Figure 5.
Effect of desensitization on the peripheral blood immune cell repertoire in case 3. (a) Analysis of PBMCs from case 3 before and after desensitization. Individual tSNE plots of the lineage defining surface markers are shown to complement the overall density plots which provide a visual overview of the changes in major immune cell subsets after desensitization. Analyses were performed using equal sampling (n=100,000). (b) Quantification of major PBMC subsets before and after treatment. Peripheral blood CD19+ B cells were reduced (7.2% to 1.0%) and CD14+ monocytes increased (16.6% to 27.6%) with treatment. (c) Unsupervised cluster analysis of CD4+ T cells using self-organizing maps (flowSOM) and consensus hierarchical clustering identified two metaclusters with an activated T follicular helper cell (Tfh) phenotype (M5, ICOS+CD38+PD1+CXCR5dim and M9, CXCR5brightCD38+ICOSdim). Median surface marker expression is normalized to the cluster with the minimum expression in each row. (d) Changes in the frequency of CD4+ T cells in each metacluster. Tfh (M5 and M9) were amongst the populations most reduced after desensitization. (e) Analysis of CD3-CD19-CD14-CD56+NK cells before and after desensitization. Marked shifts in the size of major metaclusters (top) are seen which visually correspond to increased CD38 and CD45RA expression (bottom). (f) Pie charts illustrating the changes in metacluster frequency (left) and a heatmap providing an overview of the surface markers defining each metacluster (right). Metaclusters are arranged from left to right in order of the change in their frequency after desensitization (M5,7,3,10,6,9 increased; M1, no change; M2,8,4 decreased). Median surface marker expression is normalized to the cluster with the minimum expression in each row.

