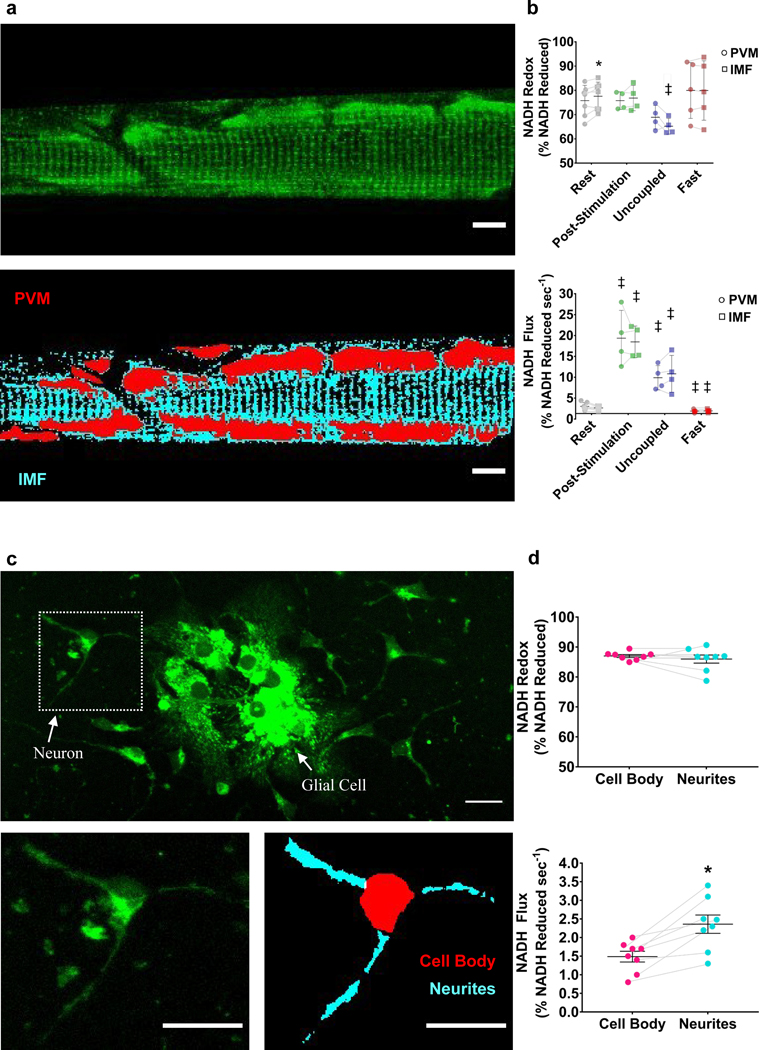
Figure 6. Mitochondrial network regional flux analysis.
a. Representative average image (top) and analysis of PVM and IMF mitochondrial subfractions (bottom) in an oxidative muscle fiber. b. Redox status (top) and mitochondrial flux rates (bottom) of PVM and IMF mitochondria in the basal (n = 7 fibers from 5 mice), post-stimulated (n = 4 fibers from 4 mice), uncoupled (n = 4 fibers from 4 mice), and fasted (n = 5 fibers from 4 mice) states in vivo. ‡ indicates significantly different from rest (p < 0.05). * indicates statistical difference between mitochondrial subfractions within the same cell (p < 0.05). c. Representative average image of primary cultured neurons and glial cells from hippocampal tissues (top) and analysis of cell body and dendrite mitochondrial NADH flux in single neuron (bottom). d. Redox status (top) and mitochondrial flux rates (bottom) of cell body and dendrite mitochondria (n = 8 cells from 3 biological samples). * indicates statistical difference between the cell body and neurite subcellular regions (p < 0.05).

