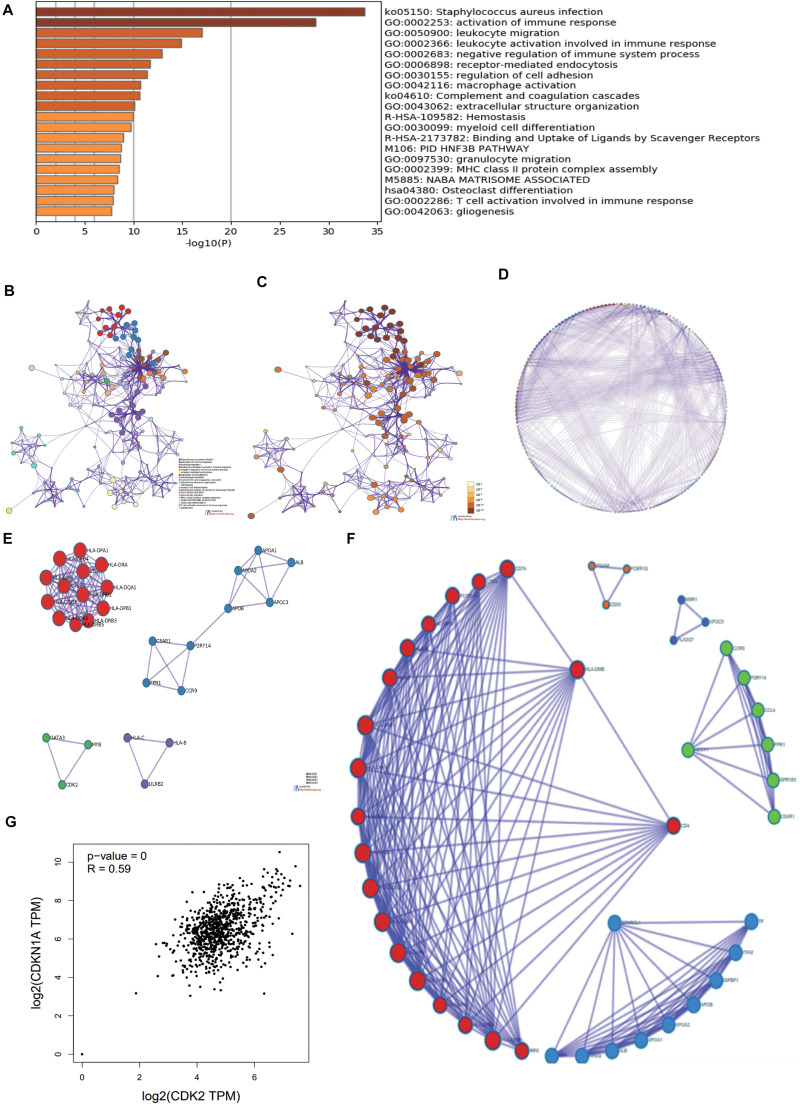
FIGURE 3.
The GO, KEGG analysis of 250 DEmRNAs. (A) Through Metascape software, we found most enriched items. (B) The related paths were shown in the network diagram. (C,D) the P-value of different pathways. (E) According to the relationship of DE mRNAs, several protein analyses were performed. (F) CDK2, MYB, GATA3 were connected each other in some tumor pathway from the circle graph. (G) There was a positive correlation between CDK2 and CDKN1A using GEPIA.

