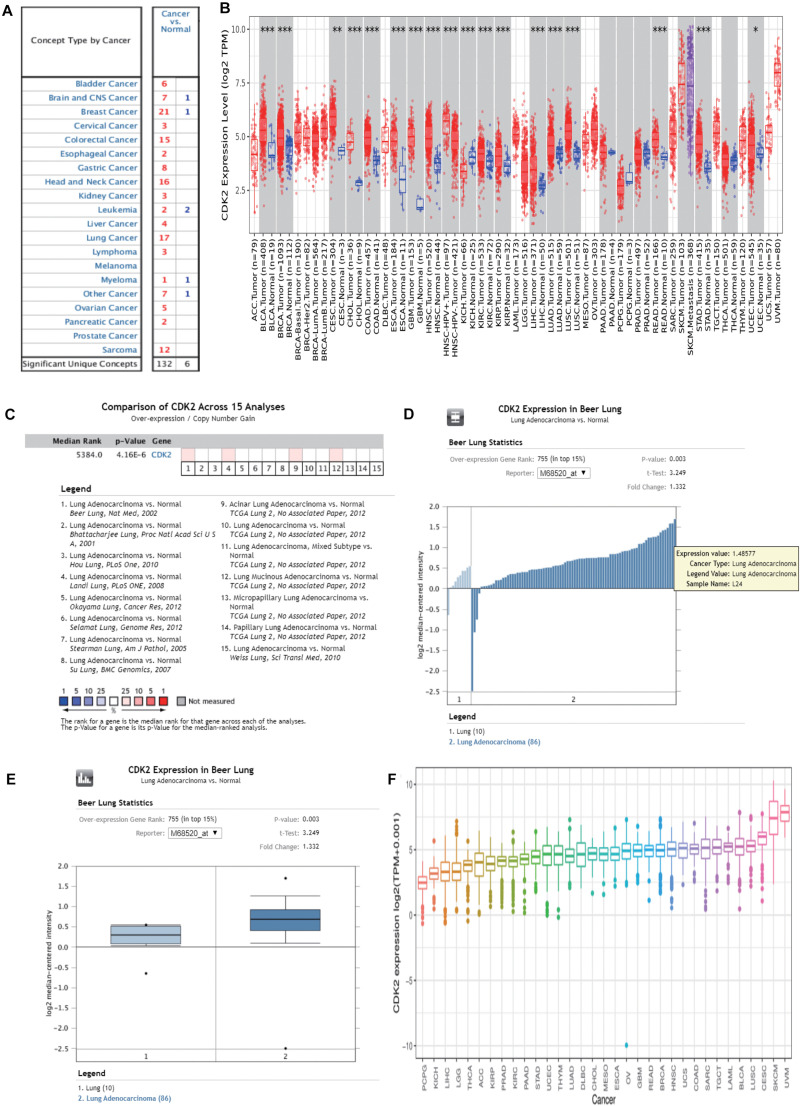
FIGURE 5.
The expression of CDK2 in pan-cancer analysis. (A) Through the Oncomine database, the expression of CDK2 was higher in 15 cancer tissues than normal tissues. (B) The expression of CDK2 in TIMER database. (C) Mata analysis of 15 published studies on LUAD showed that the expression of CDK2 was high in LUAD. (D,E) By t-test, Box plot and peak plot of CDK2 in LUAD. (F) The expression in 33 cancer, a pan-cancer analysis.

