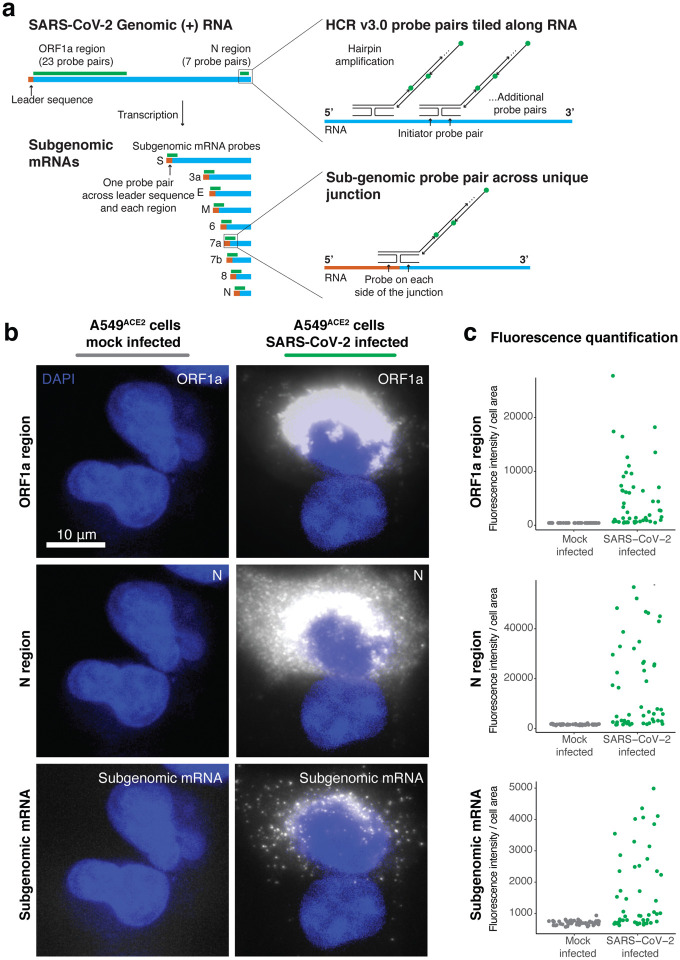
Figure 1: RNA FISH HCR v3.0 probe sets enable direct visualization of the SARS-CoV-2 virus.
a. Schematic of the SARS-CoV-2 genomic RNA and subgenomic RNA species with HCR v3.0 probe designs highlighted. We developed probes tiled along the ORF1a and N regions of the SARS-CoV-2 (+) RNA strand. These probe sets consisted of 23 probe pairs for ORF1a and 7 probe pairs for N. To detect all of the sub-genomic RNAs, we positioned the HCR probes across the junction of the leader sequence and each unique sub-genomic transcript. In the schematic, the leader sequence is shown in orange, the transcript is shown in blue and the probe design is shown in green. b. Representative images of the A549ACE2 cells mock infected or infected with SARS-CoV-2 at an MOI=1, fixed 24 hours post infection, and then hybridized with probes for ORF1a, N, and sub-genome. DAPI labels cell nuclei. Scale bar applies to all images and shows 10 μm. c. Quantification of the fluorescence signal from the experiment in b. For each, the mock infected data set (shown in gray) and the SARS-CoV-2 infected data set (shown in green), we quantified fluorescence signal intensity from 50 cells per condition. Note that the SARS-CoV-2 infected sample contained both cells that were infected and cells that remained uninfected.

