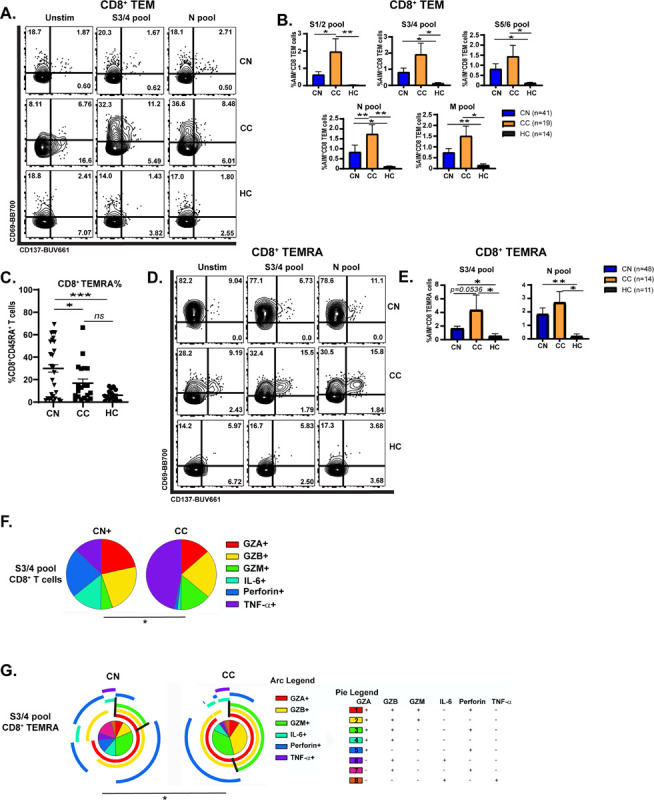
Figure 4: Neuro-PASC long-haulers have decreased CD8+ memory T cell activation and function compared with healthy convalescents.

A.) Selected FACS plots showing CD8 TEM cells are less activated in CN vs. CC groups after S and N peptide pool stimulation. B.) Quantification of AIM+ CD8 TEM cells after SARS-CoV-2 peptide stimulation. C.) CD8+ TEMRA cells accumulate significantly in PBMC from CN subjects compared with CC or HC. D.) CD8+ TEMRA cells from CN patients are less activated by S3/4 and N pools compared with those from CC subjects. E.) Quantification of AIM+ CD8+ TEMRA cells from D. F.) Pie charts demonstrating that S3/4-specific CD8+ TEM are polarized to produce more TNF-α in CC group while those from CN patients produce significantly more IL-6. G.) CD8+ TEMRA from CC patients are polarized towards category 2 cytokine production in response to S3/4 stimulation compared with CN subjects. Black lines demonstrate boundaries of category 2 cytokine production in each group. Data combined from 5 independent experiments with n=35 CN, n=11 CC. *p<0.05, **p<0.01 using two-tailed Student’s t test with Welch’s correction (B, C, E) or permutation test (F, G). All pie graphs are showing data after subtracting background (unstimulated condition).
