
Figure 6: Spike-specific T cell responses wane within 4 months after vaccination in CC and HC subjects while remaining high in CN patients over time.
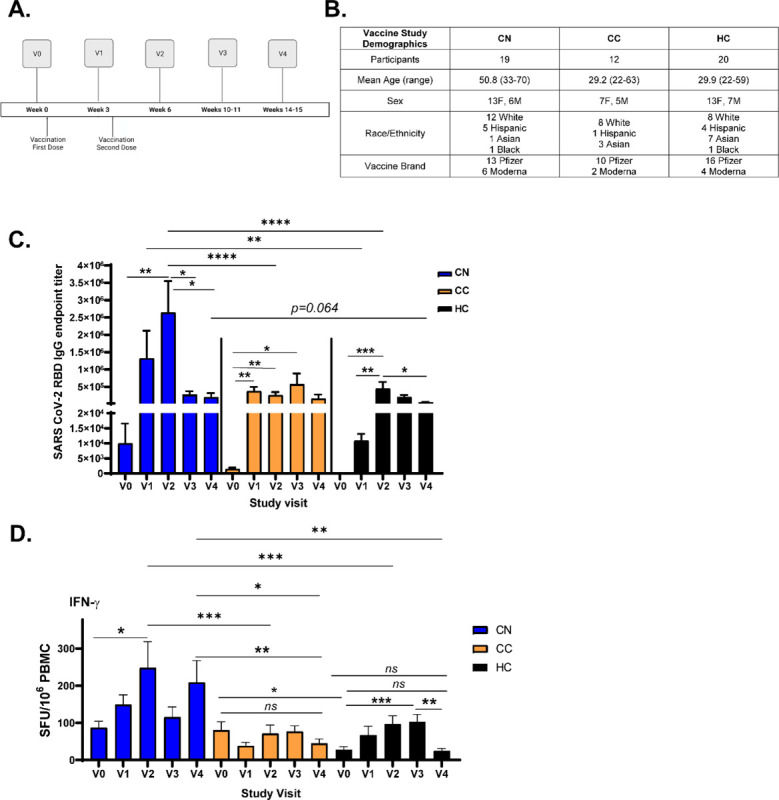
A.) Vaccine study visit timeline. V0 was obtained before the first dose of either Pfizer or Moderna mRNA vaccines. V1 and V2 were conducted 3 weeks after the first and second doses, respectively. B.) Vaccine study subject demographics. C.) Longitudinal anti-Spike RBD IgG responses from V0–V4 across groups. Antibody titers are highest in CN patients and wane most quickly in HC subjects. D.) IFN-γ production from Spike-specific T cells do not significantly increase in CC and HC groups while remaining high in CN up to V4 post-vaccination. Total S-specific IFN-γ SFU calculated by averaging responses from each sub-pool for each participant (data in Fig. S9). Data combined from 10 individual experiments with all ELISA conditions done in triplicate and all ELISPOT conditions plated in duplicate. *p<0.05, **p<0.01, ***p<0.005, ****p<0.0001 by two-way ANOVA with Tukey’s posttest or by two-tailed Student’s t test.