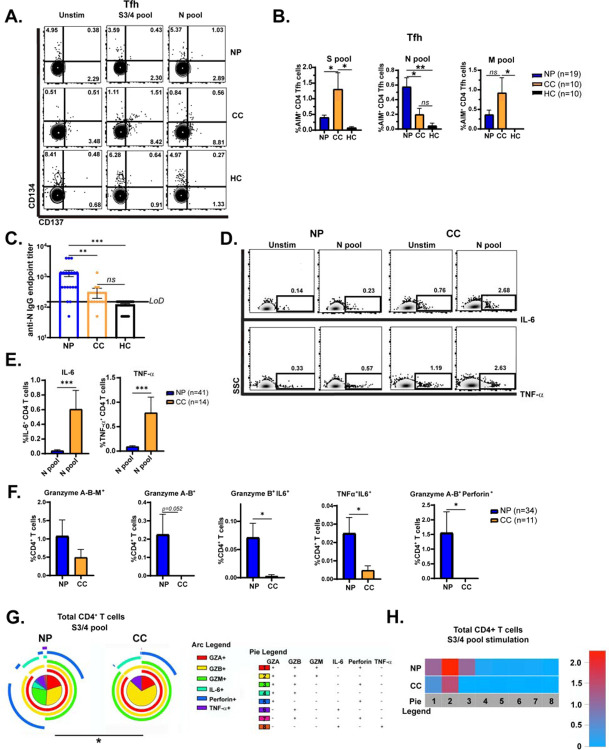
Figure 3: Tfh cell activation and CD4+ T cell polyfunctionality in response to SARS-CoV-2 structral proteins in Neuro-PASC.
A.) FACS plots showing that Ag-specific CD4+ Tfh from NP patients are more highly activated in response to N peptide pool stimulation compared with CC, but less activated by Spike peptides. B.) Quantification of AIM+ Tfh cell activation to S, N, and M peptides. C.) Anti-SARS-CoV-2 Nucleocapsid IgG endpoint titers for NP, CC, and HC subjects shown in 3B. NP patients display significantly elevated anti-N IgG titers compared with CC subjects. D.) CD4+ T cells from NP produce significantly less IL-6 and TNF-α in response to N pool stimulation compared with CC individuals. E.) Quantification of cytokine production from D. F.) CD4+ T cells from NP subjects have enhanced polyfunctionality and granzyme production after S3/4 peptide stimulation compared with CC subjects. G.) Pie graphs show CD4+ T cells from CC subjects have enhanced production of granzymes A & B, granzyme B & IL-6, and TNF-α & IL-6 compared with NP subjects in response to SARS-CoV-2 S3/4 pool stimulation. H.) Heatmap quantifying polyfunctionality in different categories of cytokine production between groups. NP subjects produced 2-fold more granzymes A/B/M than CC. Data combined from 6 independent experiments with NP n=34, CC n=11. *p<0.05, **p<0.01, ***p<0.005 using one-way ANOVA with Bonferroni’s posttest (B, C); two-tailed Student’s t Test with Welch’s correction (E, F) or a Permutation test (G). All pie graphs are showing data after subtracting background (unstimulated condition; Fig. S6A).

