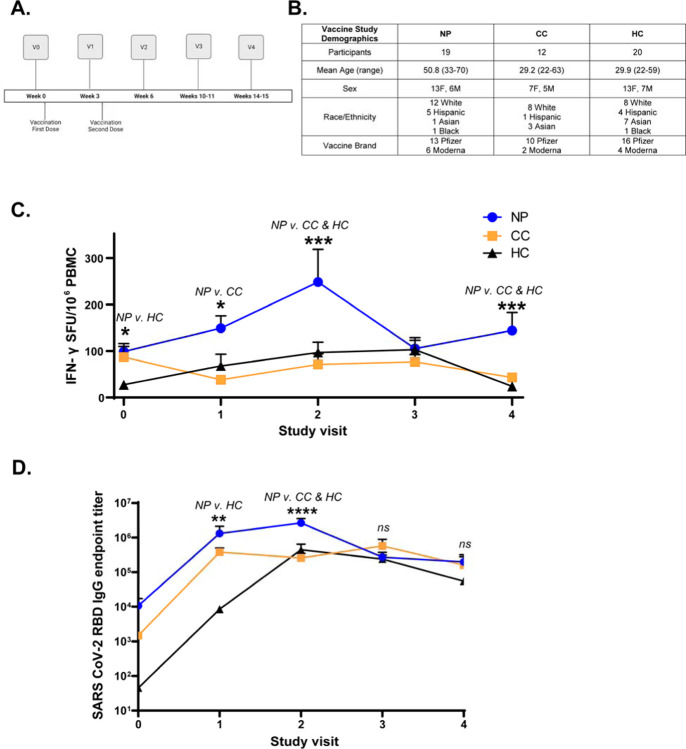
Figure 6: Spike-specific T cell and antibody responses after vaccination in Neuro-PASC and COVID convalescents.
A.) Vaccine study visit timeline. V0 was obtained before the first dose of either Pfizer or Moderna mRNA vaccines. V1 and V2 were conducted 3 weeks after the first and second doses, respectively. B.) Vaccine study subject demographics. C.) IFN-γ production from Spike-specific T cells do not significantly increase in CC and HC groups while remaining high in NP at 4 months post-vaccination. Total S-specific IFN-γ SFU calculated by averaging responses from each sub-pool for each participant (data in Fig. S9). D.) Longitudinal anti-Spike RBD IgG responses from V0–V4 across groups. Antibody titers are highest in NP patients at V2 and wane most quickly in HC subjects. Titers were not significantly different pre-vaccination (V0) between NP and CC individuals. Data combined from 10 individual experiments with all ELISA conditions done in triplicate and all ELISPOT conditions plated in duplicate. *p<0.05, **p<0.01, ***p<0.005, ****p<0.0001 by two-way ANOVA with Tukey’s posttest or by two-tailed Student’s t test.

