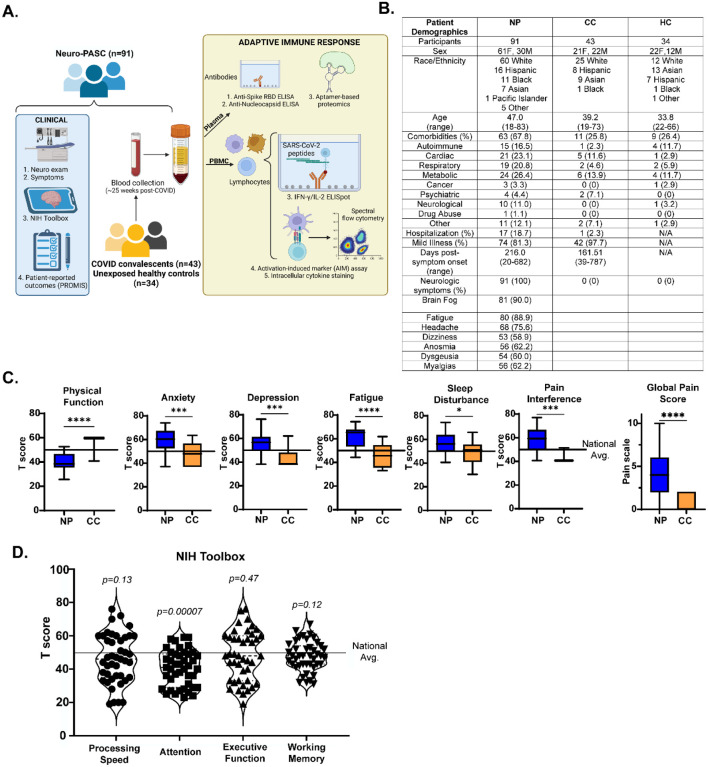
Figure 1: Study design and clinical data.
A.) Study design, including clinical and immunological data collection. B.) Demographic table for Neuro-PASC, COVID convalescent, and healthy control subjects. C.) PROMIS-57 patient-reported survey T scores for Neuro-PASC patients (n=36) and COVID convalescents (n=13). D.) NIH Toolbox cognitive T scores for Neuro-PASC patients (n=55). Horizontal black line represents the U.S. national average T score of 50; p values relative to demographic-matched US national average by one sample Wilcoxon signed rank test. *p<0.05, ***p<0.005, ****p<0.0001 by two-tailed Student’s t test.

