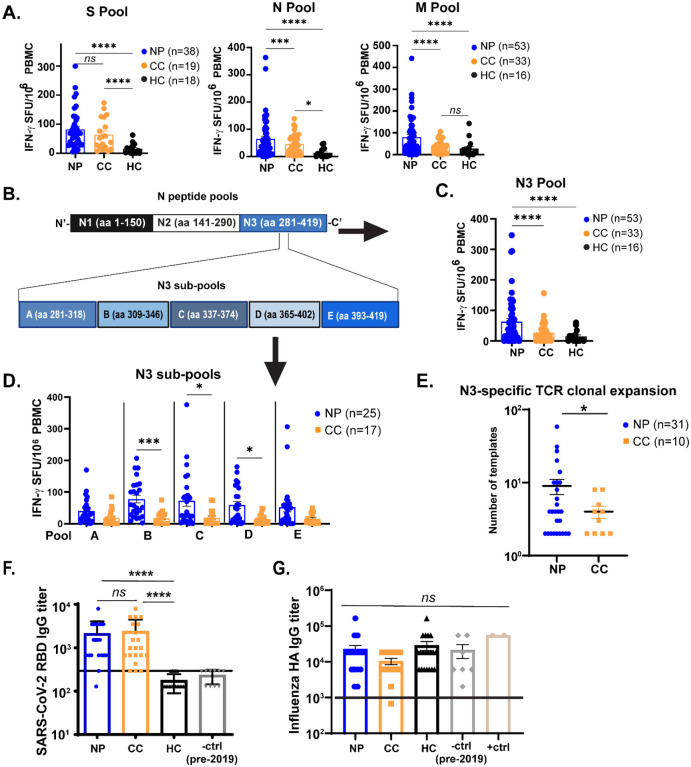
Figure 2: T cells from Neuro-PASC patients have elevated responses to SARS-CoV-2 Nucleocapsid and Membrane proteins compared to COVID convalescents.
A.) Unvaccinated Neuro-PASC patients and healthy COVID convalescents display similar IFN-γ responses to SARS-CoV-2 S peptides, but Neuro-PASC patients have enhanced N- and M peptide-specific responses. B.) Diagram of sub pools derived from N protein (N1-N3, top) and further subdivision of the N3 peptide pools into 5 sub pools (A-E, bottom). C.) Neuro-PASC T cells have enhanced IFN-γ responses to the C-terminal region of the N protein (N3) compared to control groups. D.) Neuro-PASC T cells are more highly reactive to certain regions of the C-terminal domain of N protein, particularly amino acids 309–346, of the SARS-CoV-2 Nucleocapsid protein compared with COVID convalescents. E.) Mapping of TCR sequences to SARS-CoV-2 Nucleocapsid peptide reveals enhanced N3-specific clonal expansion in Neuro-PASC patients. F.) Spike RBD antibody response quantification for all groups. G.) Influenza A hemagglutinin (HA) antibody responses for all groups. +ctrl = plasma from patients who received the Influenza vaccine within 3 weeks before sample collection. Vaccinated individuals were included in CC samples for Fig. 2A–D for N and M-specific responses, as SARS-CoV-2 vaccination does not impact T cell responses to viral proteins other than Spike. TCR antigen specificity was identified using the immuneCODE database from Adaptive Biotechnologies. Horizontal black line in F-G = limit of detection. Data representative of 10 experiments with all conditions plated in duplicate. *p<0.05, **p<0.01, ***p<0.005, ****p<0.0001 by one-way ANOVA with Tukey’s posttest (A,C, F) or t Test with Welch’s correction (D, E).

