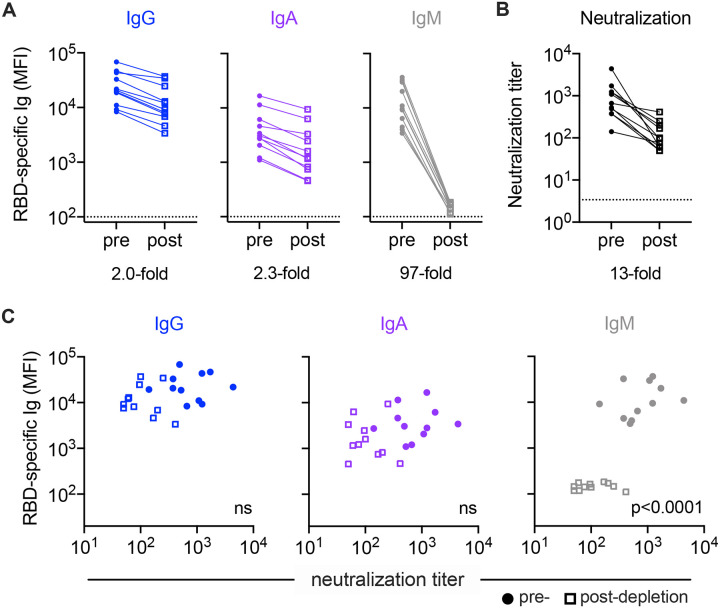
Figure 4: Experimental validation of IgM-mediated neutralization.
A. Median fluorescent intensity (MFI) levels of RBD-specific IgG, IgA, IgM observed pre- (filled circles) and post-(hollow squares) IgM depletion. Mean fold change in MFI across samples for each isotype is indicated below the figure. B. Neutralization titers pre- and post-IgM depletion. C. Comparison of RBD-specific Ig levels to neutralization titer. Statistical significance (two-tailed p value) of Spearman correlation coefficients reported in inset.

