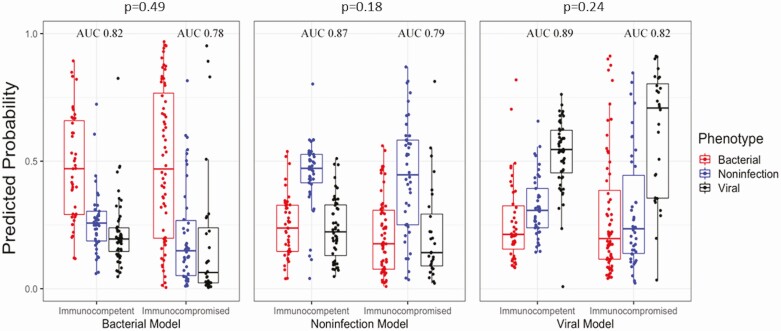
Figure 3.
Illness etiology probabilities. These boxplots report predicted probabilities based on a fixed-weight model trained on the immunocompetent cohort. The distribution of probabilities for 3 models is shown: bacterial vs nonbacterial (left), noninfectious vs others (center), and viral vs nonviral (right). For each model, subjects adjudicated as having bacterial infection (red), noninfectious illness (blue), or viral infection (black) are displayed. All subjects (136 in the immunocompetent cohort, 134 in the immunocompromised cohort) are represented in each of the 3 models. P values are reported for the comparison of overall accuracy between immunocompetent and immunocompromised subjects. Abbreviation: AUC, area under the curve.

