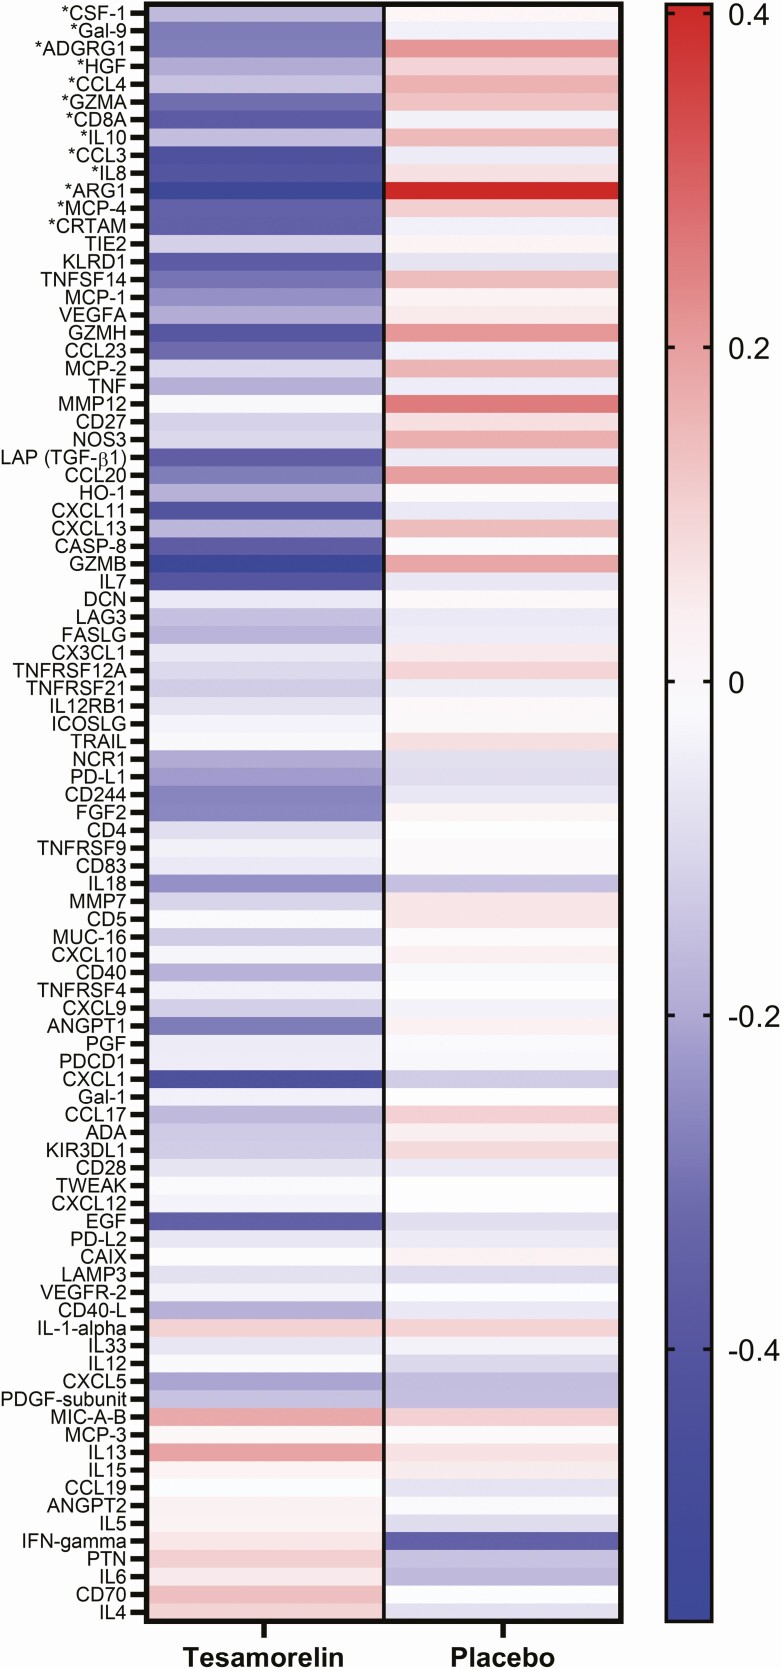
Figure 2.
Heatmap comparing within-group changes in immuno-oncology proteins. Heatmap indicating the strength and directionality of the within-group log2 fold changes over 12 months in the tesamorelin (left) and placebo (right) treatment groups. Proteins are ordered from top to bottom according to t-statistic for the between-group comparison, with the lowest t-statistic at the top. Blue indicates decrease and red increase. *Denotes proteins with statistically significant changes over time (FDR-q < 0.1) between tesamorelin and placebo groups. Abbreviations: ADGRG1, adhesion G-protein coupled receptor G1; ARG1, Arginase-1; CCL3, C-C motif chemokine 3; CCL4, C-C motif chemokine 4; CD8A, T-cell surface glycoprotein CD8 alpha chain; CRTAM, cytotoxic and regulatory T-cell molecule; CSF-1, Macrophage colony-stimulating factor 1; FDR, false discovery rate; Gal-9, Galectin-9; GZMA, Granzyme A; HGF, Hepatocyte growth factor; IL8, Interleukin-8; IL10, Interleukin-10; MCP-4, C-C motif chemokine 13.

