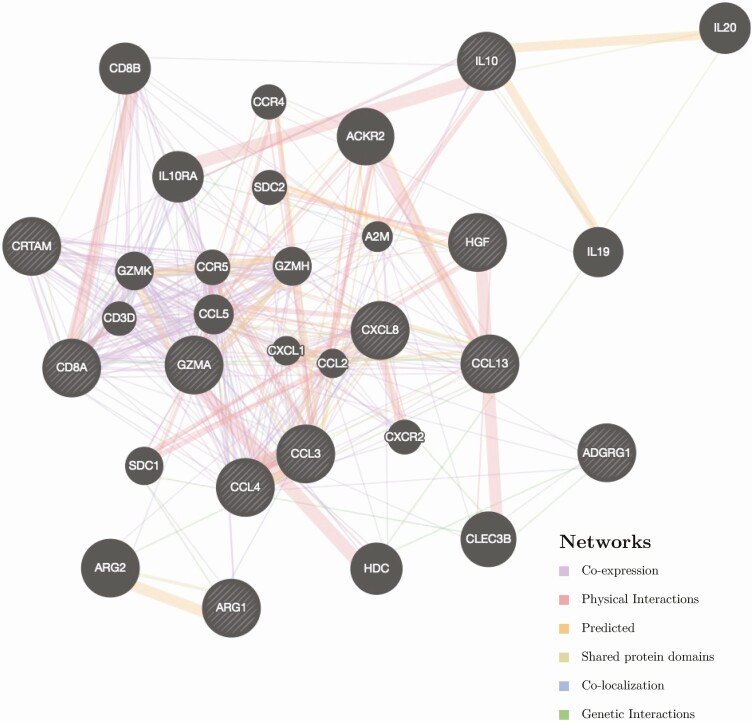
Figure 3.
Network analysis. Network analysis using GeneMANIA analytical software showing the potential relationships of proteins altered by tesamorelin with false discovery rate < 0.1 (denoted by light diagonal lines against black background), along with other proteins in the network (denoted by solid black fill). The line color connecting each of the proteins represents the different types of relationship between each respective protein, as shown in the legend in the bottom right of the figure. Line thickness represents relative strength of relationships. Abbreviations: ADGRG1, adhesion G-protein coupled receptor G1; ARG1, Arginase-1; CCL3, C-C motif chemokine 3; CCL4, C-C motif chemokine 4; CD8A, T-cell surface glycoprotein CD8 alpha chain; CRTAM, cytotoxic and regulatory T-cell molecule; CSF-1, Macrophage colony-stimulating factor 1; Gal-9, Galectin-9; GZMA, Granzyme A; HGF, Hepatocyte growth factor; IL8, Interleukin-8; IL10, Interleukin-10; MCP-4, C-C motif chemokine 13.

