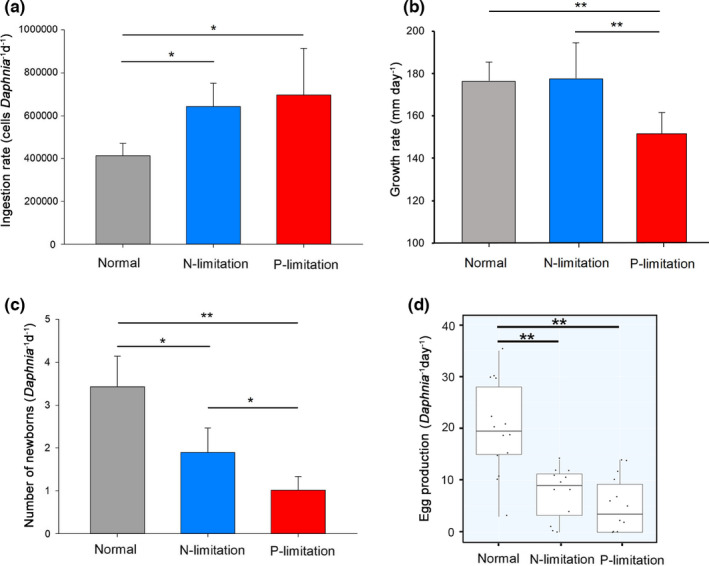
FIGURE 1.

Performances of Daphnia magna fed with different types of algae on the 7th day. (a) shows the average (with standard deviation, SD) ingestion rate of one individual D. magna; (b) shows the average (with SD) increase in body length as an index of growth rate for D. magna; (c) is the average number (with SD) of newborns of one individual D. magna; and (d) is the egg production rate of each D. magna. Significant difference between groups is marked with asterisk (*p < .05 and **p < .01, by Welch two sample t test)
