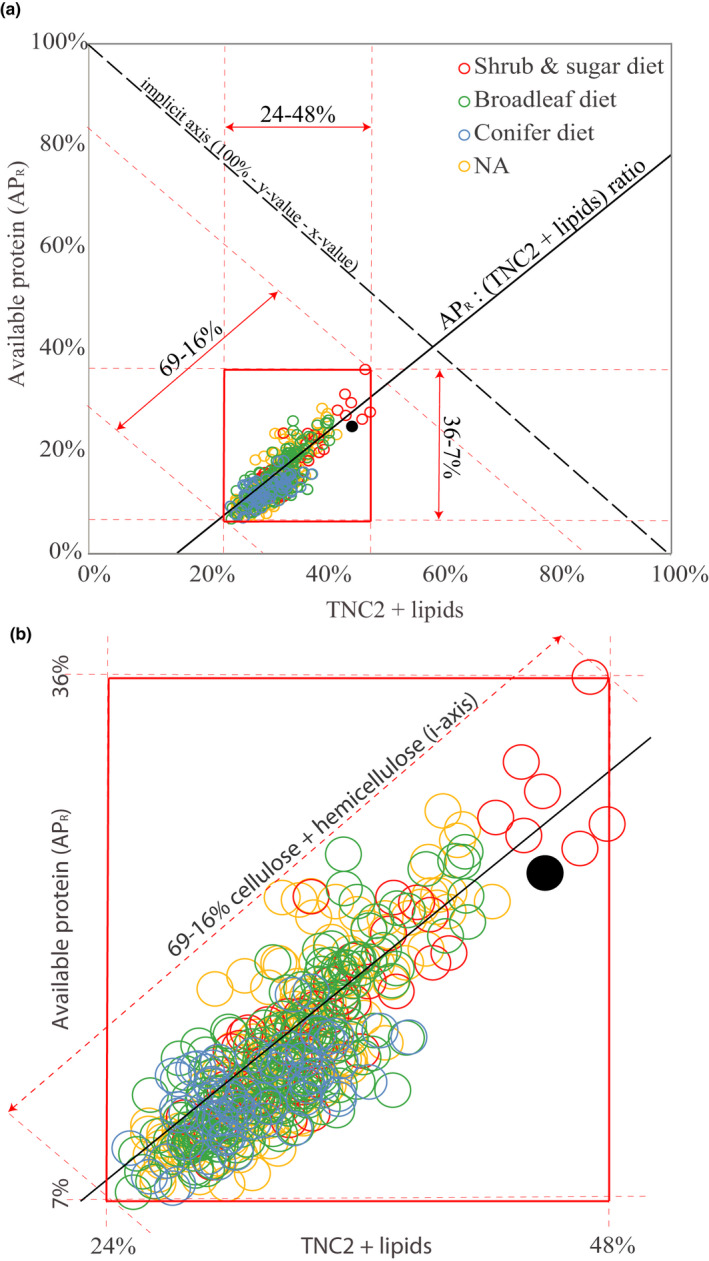
FIGURE 2.

(a) Right‐angled mixture triangle (RMT) (Raubenheimer, 2011) depicting the relative components of macronutrient content in individual moose rumen samples (n = 481) collected during the winter 2014/15 in southern Sweden, expressed as a percentage of total macronutrients in g dry matter (dm). X‐axis = % macronutrients providing highly digestible energy (a combined measure of total nonstructural carbohydrates and lipids (TNC2+lipids)). Y‐axis = % available protein (APR) which includes microbial‐N. I‐axis (implicit axis, i.e., 100% minus y‐value minus x‐value) = % cellulose and hemicellulose (fibers). Increased distance from the hypotenuse means increased % fiber. Circles = composition of individual rumen samples. For example, the filled black circle represents a sample (approx. one meal) with contributions of 25% AP, 30% fiber, and 45% TNC2+lipids, totaling 100%. Solid black line: linear relationship between (nonstandardized) % APR and %TNC2+lipids (y = 0.98x − 0.17, R² = 0.70). Dashed red lines draw the upper and lower limits of the three dimensions’ observed ranges, while solid red lines mark the resulting range of observations, which is expanded in panel (b). (b) Three diet types (distinguished by color) were identified in these moose populations through rumen analysis, as classified by a previous study (Table 1 and Felton, Holmström, et al., 2020)). NA (yellow circles) indicates rumen samples where such plant identification data are not available. Note that no representatives of the “conifer diet” had less than 45% fiber (of total macronutrients), while the other two diet types were represented across the entire range of % fiber
