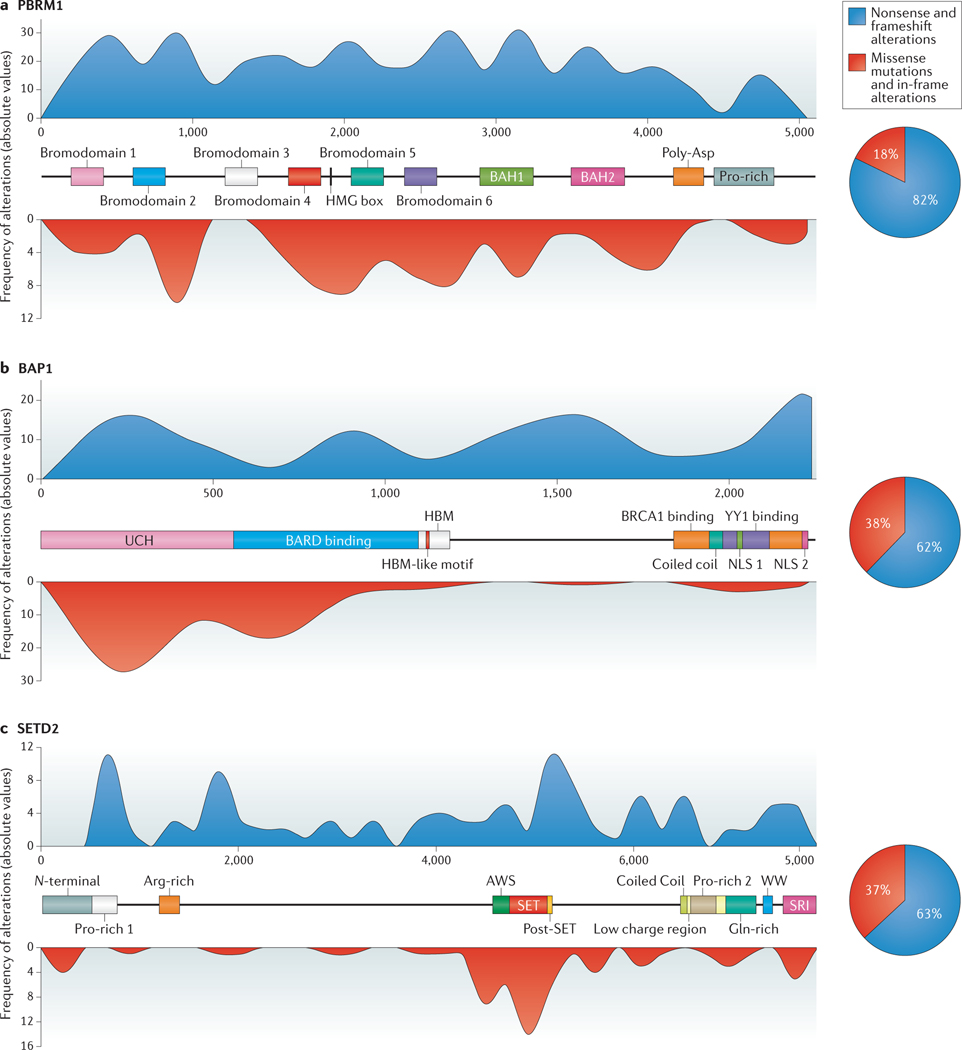
Figure 2 |. Structure and distribution of PBRM1, BAP1 and SETD2 mutations in RCC.
The known protein domains and motifs are indicated for protein polybromo-1 (PBRM1; also known as BAF180) (part a), ubiquitin carboxyl-terminal hydrolase BAP1 (part b) and histone-lysine N-methyltransferase SETD2 (part c). The overlaid blue (nonsense and frameshift alterations) and red (missense mutations and in-frame alterations) histograms represent the distribution of genetic alterations, previously reported in RCC, along each gene40,41. The X axis represents the position of cDNA bases and the Y axes for each respective histogram shows the frequency of alterations (absolute values). The associated pie charts show the proportion of nonsense and frameshift alterations (blue area) and missense and in-frame alterations (red area). Data from REFs 40,41.BAH, bromo-adjacent homology; HMG, high-mobility group; UCH, ubiquitin C-terminal hydrolase; HBM, HCF-C1 binding motif; SRI, SET2-Rpb1 interacting; NLS, nuclear localization signal.

