. 2021 Jul 2;23(16):5812–5824. doi: 10.1039/d1gc01880a

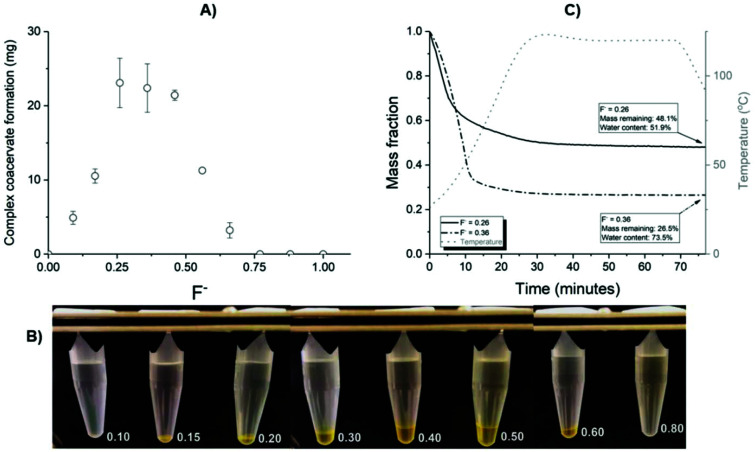
Fig. 2. Analysis of CC formation properties. (A) Total CC formed as a function of F at a polyion concentration of 20 g L−1 and a NaCl concentration of 10 mM. Values are represented as average with standard deviations from triplicate experiments. (B) Photographs of different F ratios with consistent amounts of total polyions. (C) The water content of the formed CCs was determined using TGA for F = 0.26 and 0.36 at a polyion concentration of 10 g L−1 and a NaCl concentration of 10 mM. The left Y-axis shows the remaining mass fraction of the CC as the temperature presented on the right Y-axis is increased and water is vaporized. Values in (A) represent the average with standard deviations from triplicate experiments.

Fig. 2