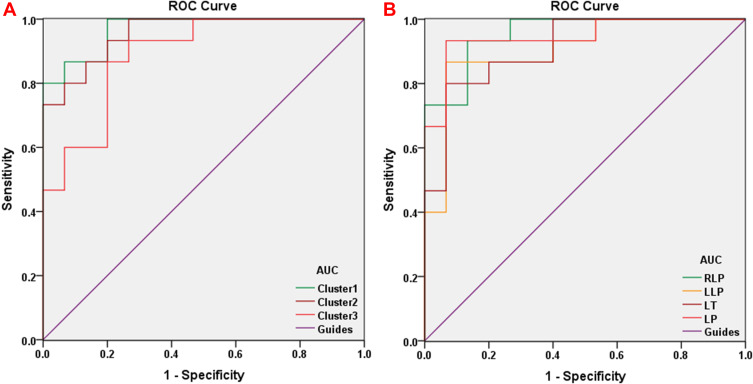
Figure 4.
ROC curve analysis of the mean GMV and WMV values for the altered brain regions. (A) The area under the ROC curve for the GMV was 0.969 for cluster 1 (LSTG/6-ALC/LMTG/LOIFG) (P<0.001; 95%CI: 0.918–1.000), 0.956 for the cluster 2 (RSTG) (P<0.001; 95%CI: 0.892–1.000) and 0.889 for cluster 3 (LMCG) (P<0.001; 95%CI: 0.774–1.000). (B) The area under the ROC curve for the WMV was 0.956 for RLP (P<0.001; 95%CI: 0.891–1.000), 0.907 for LLP (P<0.001; 95%CI: 0.796–1.000), 0.911 for LT (P<0.001; 95%CI: 0.809–1.000) and 0.947 for (P<0.001; 95%CI: 0.866–1.000).
Abbreviations: LSTG, left superior temporal gyrus; 6-ALC, sixth area of left cerebellum; LMTG, left middle temporal gyrus; LOIFG, left orbital inferior frontal gyrus; RSTG, right superior temporal gyrus; LMCG, left middle cingulum gyrus; RLP, right lenticular putamen; LLP, left lenticular putamen; LT, left thalamus; LP, left precuneus.

