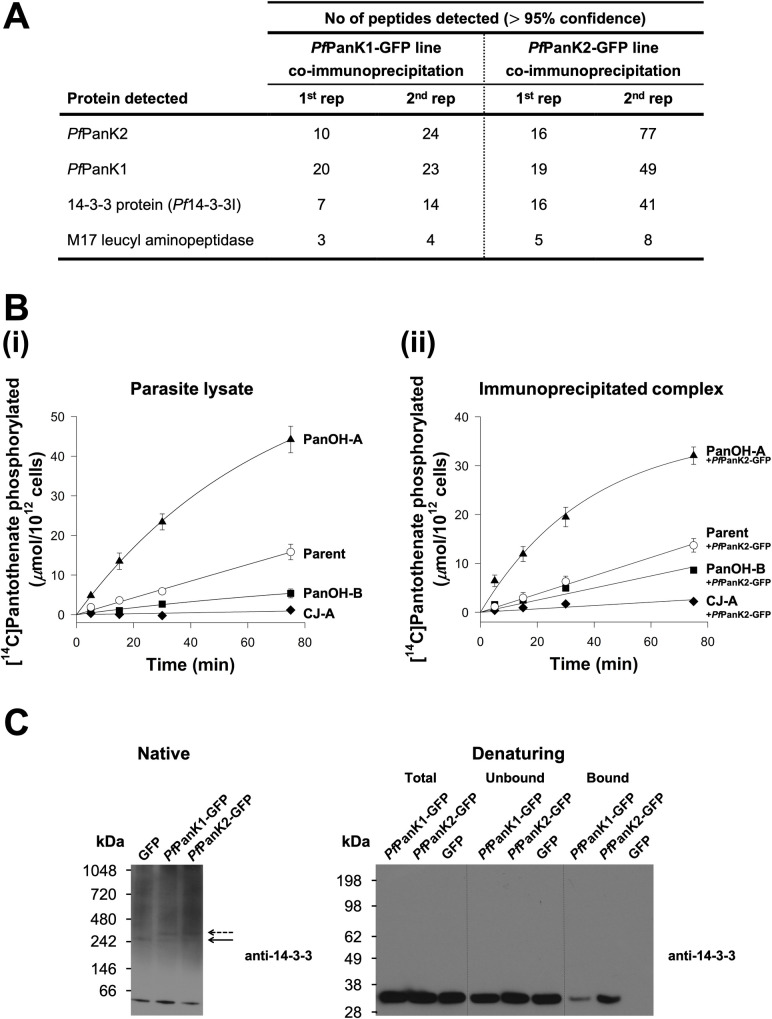
Fig 2. PfPanK1 and PfPanK2 are part of a single PanK complex that includes Pf14-3-3I.
(A) The four most abundant proteins identified in the MS analysis of proteins immunoprecipitated with GFP-Trap from the PfPanK1-GFP and PfPanK2-GFP lines. Data shown are representative of two independent analyses (1st and 2nd rep), each performed with a different batch of parasites. Proteins detected in the untagged GFP line or wild-type 3D7 parasite immunoprecipitations (negative controls) were removed. Only proteins with three or more peptides detected in both replicate co-immunoprecipitation experiments are shown. Proteins identified but which did not meet these criteria are shown in S1 Table. Proteins are listed in descending order according to the total number of peptides detected across all replicates (total peptides in all four columns). (B) The phosphorylation of [14C]pantothenate (initial concentration of 2 μM) over time by (i) lysates generated from Parent (white circles), PanOH-A (black triangles), PanOH-B (black squares) and CJ-A (black diamonds) parasite lines (reproduced from [27]) and (ii) proteins immunoprecipitated with GFP-Trap from Parent+PfPanK2-GFP (white circles), PanOH-A+PfPanK2-GFP (black triangles), PanOH-B+PfPanK2-GFP (black squares) and CJ-A+PfPanK2-GFP (black diamonds) parasite lysates. Values in (ii) are averaged from three independent experiments, each performed with a different batch of parasites and carried out in duplicate. Error bars represent SEM and are not shown if smaller than the symbols. (C) Native western blot analysis of the lysates and denaturing western blot analyses of the different GFP-Trap immunoprecipitation fractions generated from PfPanK1-GFP and PfPanK2-GFP parasite lines, with the untagged GFP line as a control. Protein samples used in the denaturing western blot were derived from the same immunoprecipitation depicted in S2 Fig. Western blots were performed with pan-specific anti-14-3-3 antibodies (previously shown to detect Plasmodium 14-3-3 [32]). Arrows indicate the position of 14-3-3-containing complexes of comparable masses in all three lines (solid arrow) and the complexes found only in the PfPanK1-GFP and PfPanK2-GFP lines (dashed arrow). The native blot shown is a representative of three independent experiments, while the denaturing blot is a representative of two independent experiments, each performed with a different batch of parasites.

