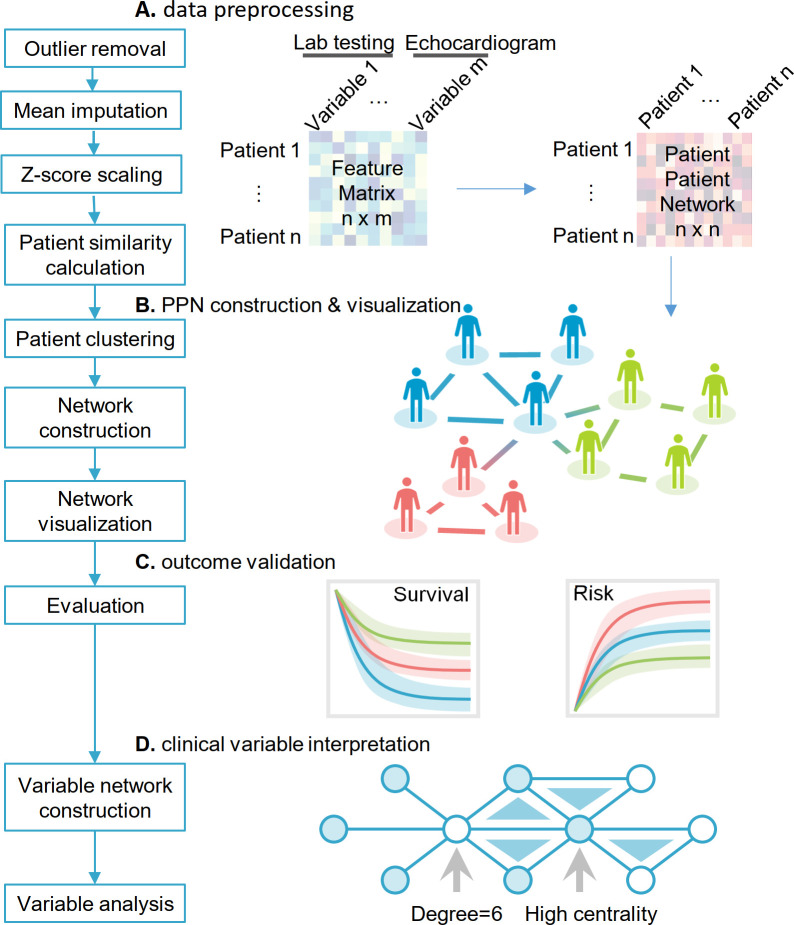
Fig 1. Overall study design.
The overall study design included 4 steps: (A) data preprocessing; (B) PPN construction and visualization; (C) clinical validation using cardiac outcomes and survival analysis; and (D) clinical variable interpretation. The data preprocessing includes outlier removal, feature scaling by z-score method, and missing data imputation. With the preprocessed patient-clinical variable matrix, we used cosine measure as the similarity metrics for generating a patient–patient similarity network. Then, we performed K-means clustering to layout patients to different subgroups based on the cosine measure (see Methods). Patients with similar clinical characteristics are grouped in the same cluster and are visualized through a specific subgroup to form the final PPN. After the patient network construction and visualization, we used 2 clinical outcomes, mortality and CTRCD to evaluate performance of network-based clustering. Finally, we performed the clinical variable network analysis to enhance clinical interpretation of each risk subgroups with CTRCD. CTRCD, cancer therapy–related cardiac dysfunction; PPN, patient–patient network.

