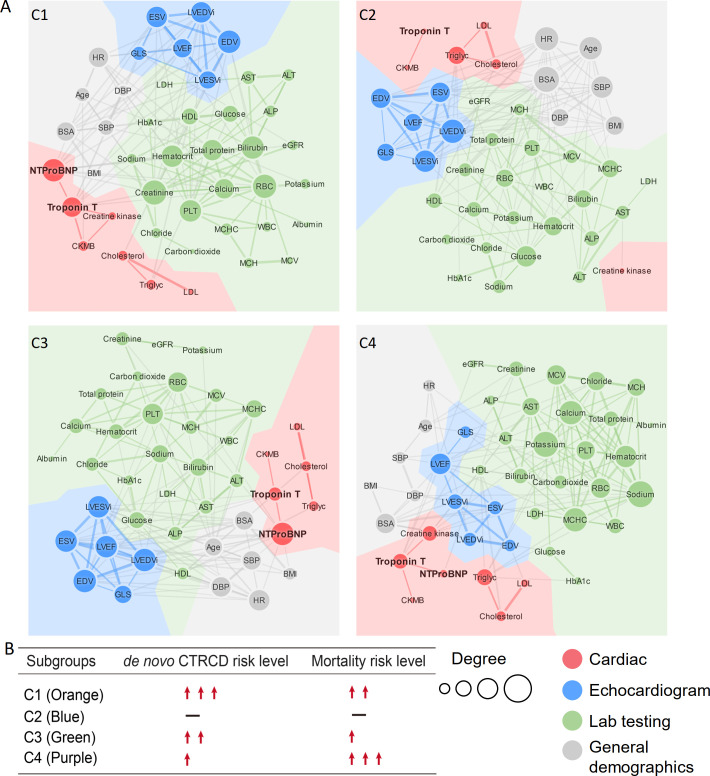
Fig 4. Clinical variable networks across 4 patient clusters.
(A) Clinical variable–variable networks across 4 patient subgroups: Orange subgroup: C1, intermediate survival and the highest de novo CTRCD risk; blue subgroup: best survival and the lowest de novo CTRCD risk; green subgroup: intermediate survival and intermediate de novo CTRCD risk; purple subgroup: the worst survival and intermediate de novo CTRCD risk. Top 15% of PCC value was used for the final cutoff for each network. At this cutoff, the highest p-value among all the correlations in all clusters was p = 0.008 (see Methods). Variables were colored by 4 categories of clinical variables: cardiac (red), echocardiogram (blue), lab testing (green), and general demographics (gray). Size of node indicates the degree (connectivity). Size of edges indicates the PCC value in the clinical variable network. (B) De novo CTRCD and mortality risk are presented for each subgroup. The abbreviations for all variables are provided in S1 Table. CTRCD, cancer therapy–related cardiac dysfunction; NT-proBNP, NT-proB-type Natriuretic Peptide; PCC, Pearson correlation coefficient.

