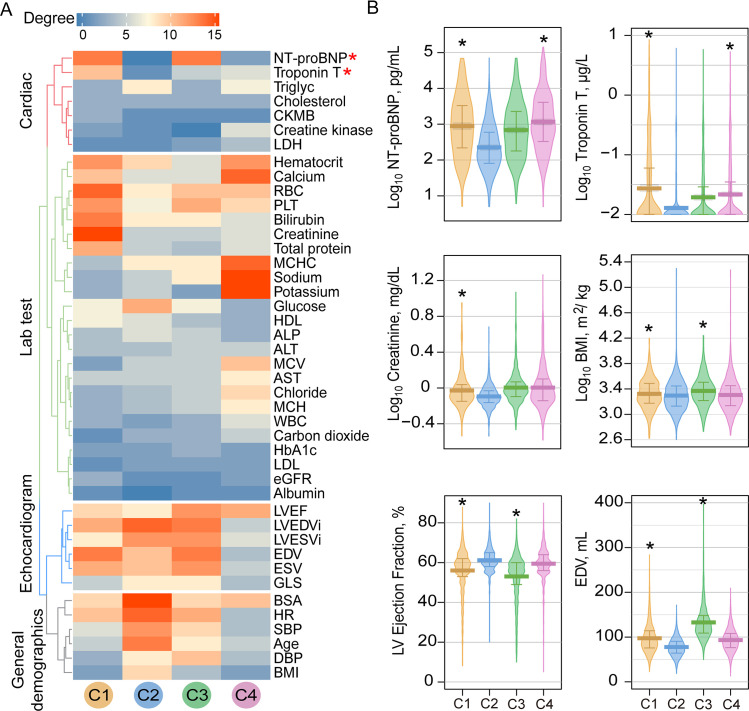
Fig 5. Network and clinical characteristics of variables across patient subgroups.
(A) Degree distribution of clinical variables across 4 patient subgroup-specific clinical variable networks. The gradient bar shows the degree (connectivity) range. The 4 colored dendrogram indicated 4 types of clinical variables (consistent with Fig 4A). The red asterisk highlights the network-identified biomarkers for CTRCD. (B) Lab testing values for 6 selected clinical variables across different patient subgroups. The vertical bar denotes the 25% to 75% range, and the thick horizontal lines in each bean plot represent the average value. The black asterisk (*) denotes statistically significantly clinical variables in a specific patient subgroup compared to the C2 subgroup (baseline; Fig 2). p-value was computed by KS test. All statistical data are provided in S8 Table. BMI, body mass index; CTRCD, cancer therapy–related cardiac dysfunction; EDV, end-diastolic volume; KS, Kolmogorov–Smirnov; LVEF, left ventricular ejection fraction; NT-proBNP, NT-proB-type Natriuretic Peptide.

