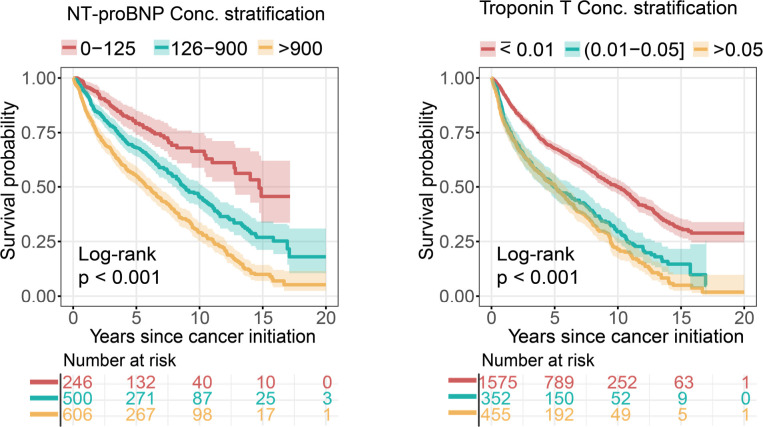
Fig 6. KM analysis of NT-proBNP and Troponin T in cancer patients.
The threshold of different NT-proBNP (pg/mL) and Troponin T (μg/L) levels were used based on published clinical guidelines. The log-rank test with the BH adjustment [42] was used for survival comparisons among 3 groups. The shadow represents 95% CIs. p-value was computed by log-rank test. BH, Benjamini and Hochberg; CI, confidence interval; KM, Kaplan–Meier; NT-proBNP, NT-proB-type Natriuretic Peptide.

