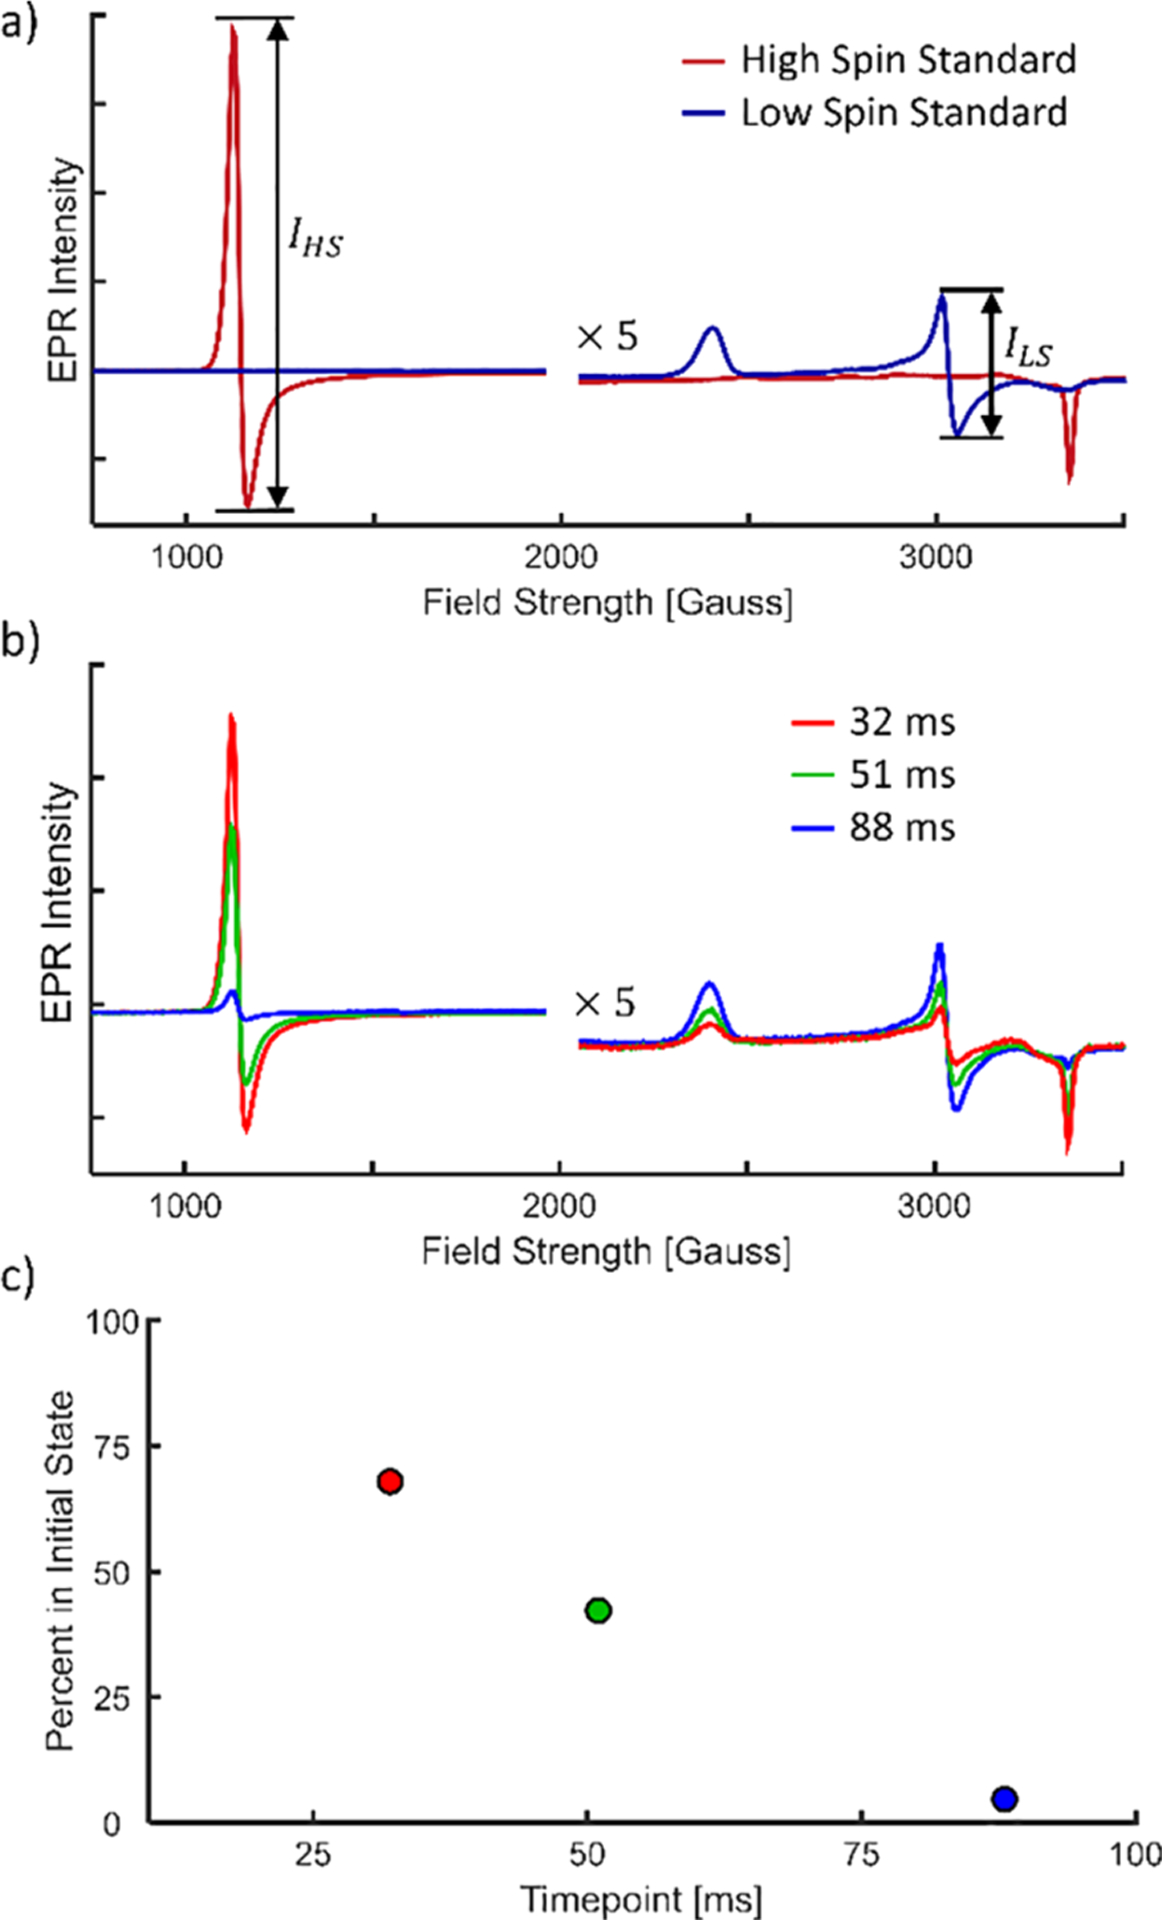
Figure 3.

EPR data for the myoglobin and 15 mM azide reaction in the solution state. EPR intensities are provided in relative units. For high field strengths, EPR intensities are multiplied by 5 for ease of viewing. (a) EPR spectra of the high- and low-spin solution standards. Peak-to-peak intensities used in data analysis are illustrated. (b) Time-resolved EPR spectra of myoglobin/azide reaction. Curves are normalized by the total myoglobin concentration (see the Supporting Information and Figure S5 for details). (c) Percent of the initial state (FHS(t)) remaining as a function of time.
