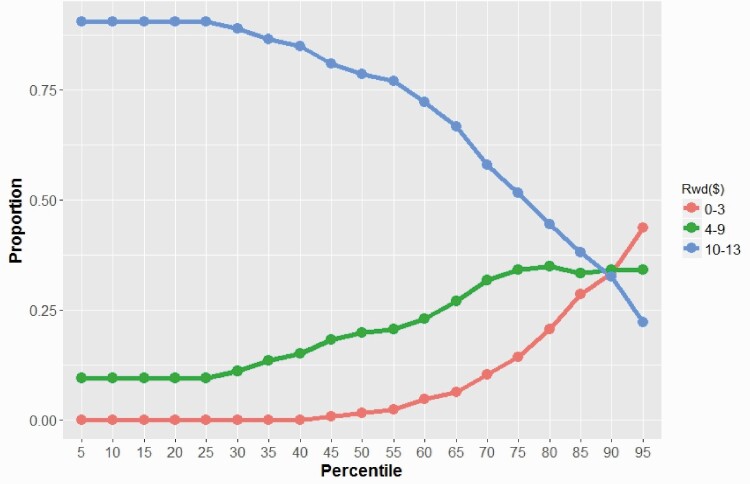
Fig 4.
Results of sensitivity analysis for the selection of the reinforcement percentile parameter. Using 25 homes from the AO arm, the reinforcement value was calculated for the different reinforcement phases under the protocol outlined in the text. This figure illustrates the proportion of reinforcement value ranging from $0–$3, $4–$9, and $10–$13 for various percentiles.

