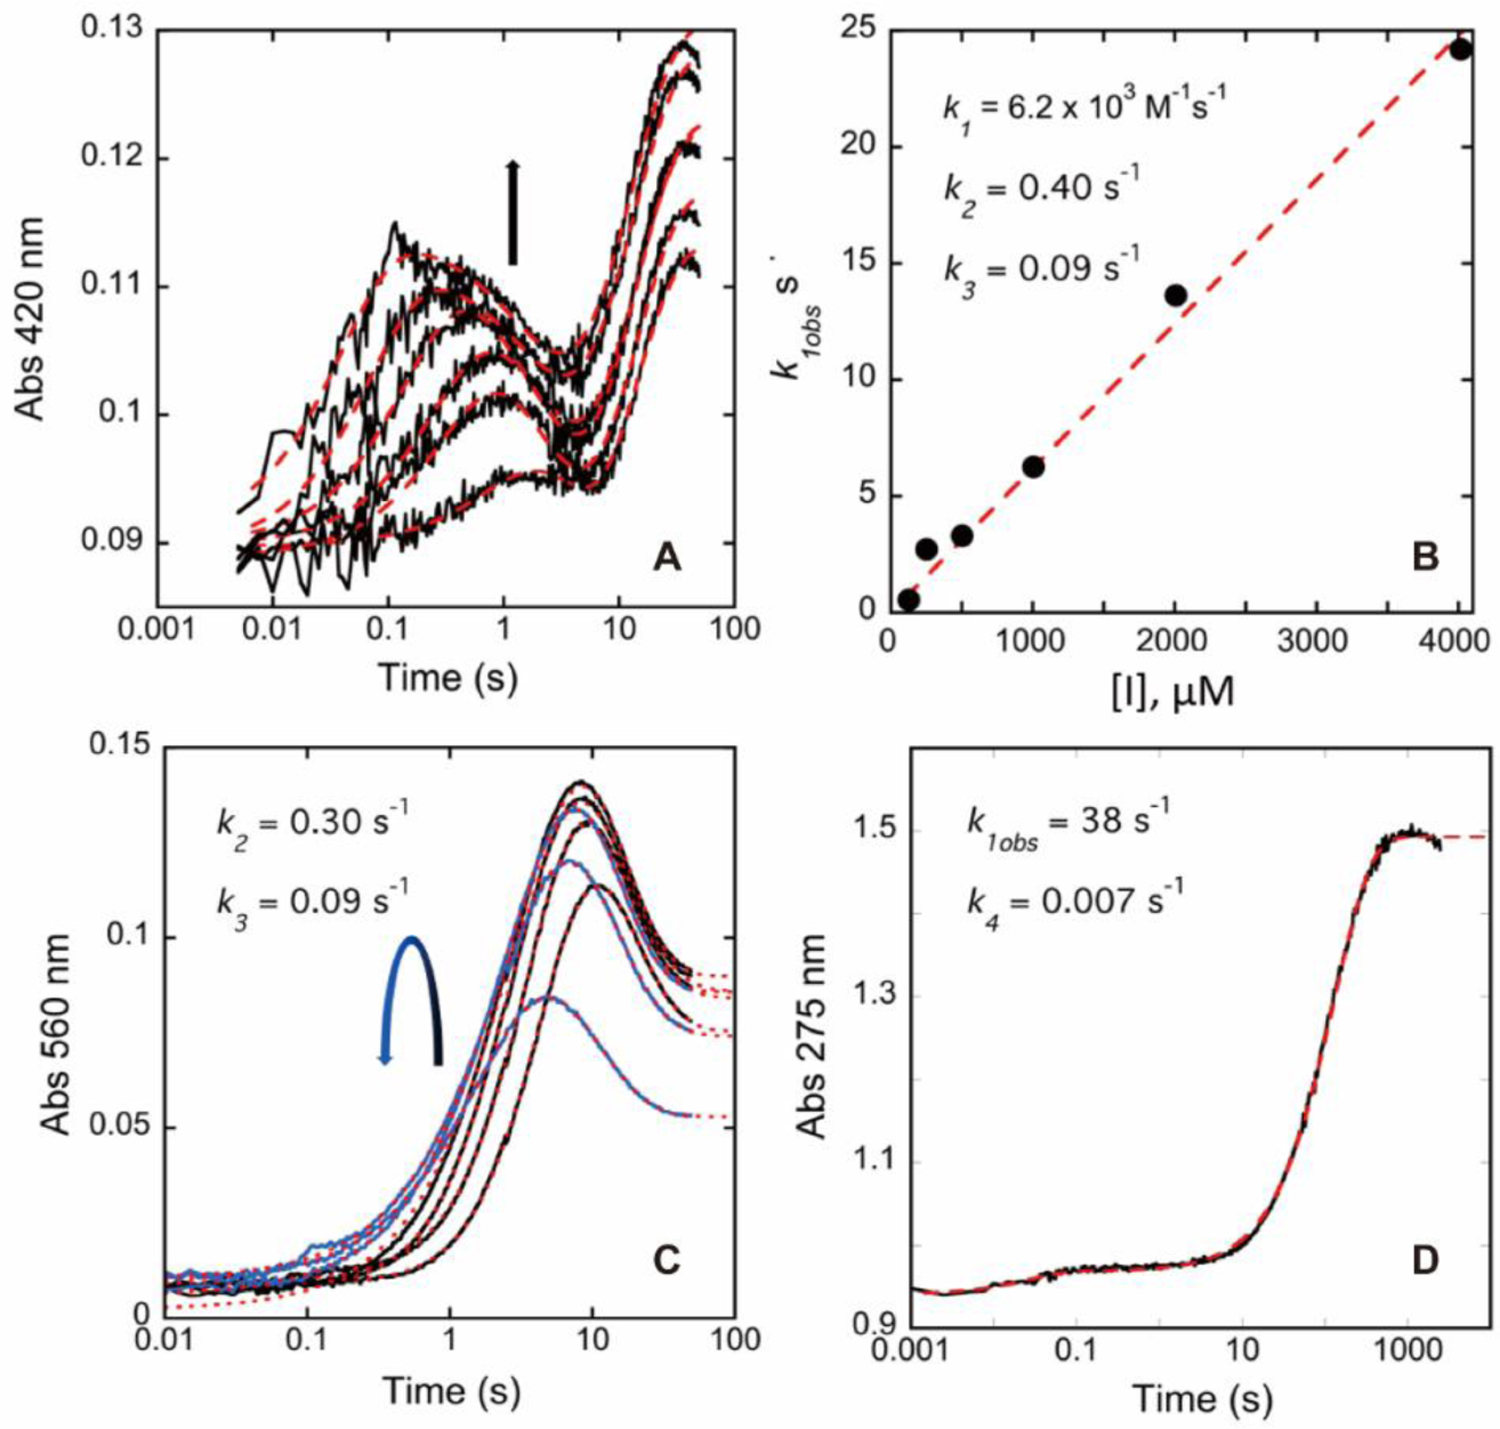
Figure 7.

Transient state absorption changes observed at 275, 420, and 560 nm for hOAT reacting with 6. OAT (12.7 µM final) was mixed with 6 (126, 251, 502, 1004, 2008, 4016 µM), and CCD spectra were collected for the timeframe 0.009–49.2 seconds. (A) The data observed at 420 nm fit to a linear combination of three exponential terms according to equation (3) described in the Supporting Information. The arrow indicates the trend observed in amplitude for increasing inhibitor concentration. (B) The observed rate constant dependence of the first phase observed at 420 nm fits equation (5) described in the Supporting Information. The values for k2 and k3 indicated are the average values obtained from the fit in Figure 7A. The fit is shown by red dashes. (C) The data observed at 560 nm. The curved arrow indicates the trend observed in amplitude for increasing inhibitor concentration. These data were fit to a linear combination of two (1004, 2008, and 4016 µM, blue traces) or three (126, 251, and 502 µM, black traces) exponential terms according to equation (4) described in the Supporting Information. The fit is shown by red dashes. (D) The data observed at 275 nm over 2000 seconds obtained in the presence of 8032 µM 6 fit a linear combination of two exponential terms according to equation (4) in the Supporting Information. The fit is shown by red dashes.
