
Table 1.
Kinetic Constants for the Inactivation of hOAT and Reversible Inhibition of GABA-AT by 4–6a
| Cmpd | Structure | hOAT | GABA-AT | ||||
|---|---|---|---|---|---|---|---|
|
| |||||||
| kinact (min−1) | KI (mM) | kinact /KI (min−1mM−1) | Partition ratioc | Fluorideion release (eq.)d | Ki (mM) | ||
| 1 |
|
0.09 ± 0.01 | 0.09 ± 0.03 | 1.0 ± 0.4 | 12 ± 1b | 79 ± 2b | 5.2 ± 0.6 |
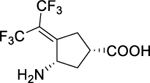
| 4 |
|
0.01 ± 0.00 | 4.00 ± 1.00 | 0.003 ± 0.001 | 2200 ± 70 | 3400 ± 30 | 0.1 ± 0.0 |
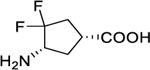
| 5 |
|
0.03 ± 0.01 | 2.00 ± 0.90 | 0.015 ± 0.006 | 790 ± 35 | 750 ± 60 | 1.4 ± 0.1 |
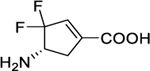
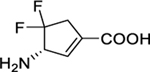
| 6 |
|
0.08 ± 0.01 | 0.06 ± 0.03 | 1.3 ± 0.7 | 34 ± 0 | 34 ± 1 | 1.1 ± 0.1 |
kinact and KI values were determined by the equation: kobs = kinact×[I]/(KI + [I]) and presented as means and standard errors. Ki values were calculated by the Cheng-Prusoff equation: Ki = IC50/(1+[S]/Km) and shown as means and standard errors. IC50 values were obtained using nonlinear regression analysis in GraphPad Prism 8 of a 9-point enzymatic assay with a 2-fold serial dilution against GABA-AT. The partition ratios were determined under conditions in the presence of α-KG, while fluoride ion release results were determined in the absence of α-KG.
Data were extracted from Reference 12.
Enzyme activity remaining was measured as a function of the number of equivalents of 4–6 relative to enzyme concentration. Linear regression analysis was used on the linear portion of the curves to obtain the x-intercept, which was the turnover number (partition ratio = turnover number −1). Data are shown as the means with standard errors.
The fluoride ion release experiments were performed in triplicates. Data are presented as the means with standard deviations.