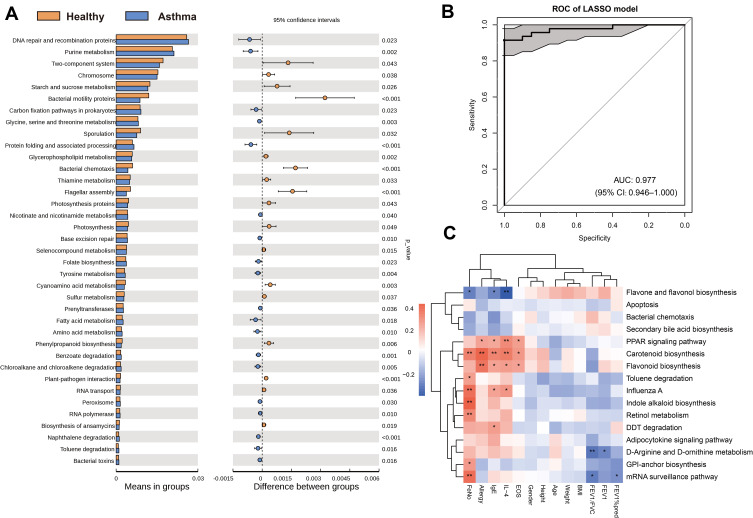
Figure 3.
Functional analysis of gut microbiota and their association with asthma. (A) Differential pathways presented in asthmatic and control groups with PICRUSt analysis. (B) Model created by 16 microbiome-encoded pathways showed an AUC of 0.977 to distinguish asthma from healthy controls. (C) Correlation analysis between functional pathways and clinical indexes in asthmatic patients. *, p < 0.05; **, p < 0.01.

