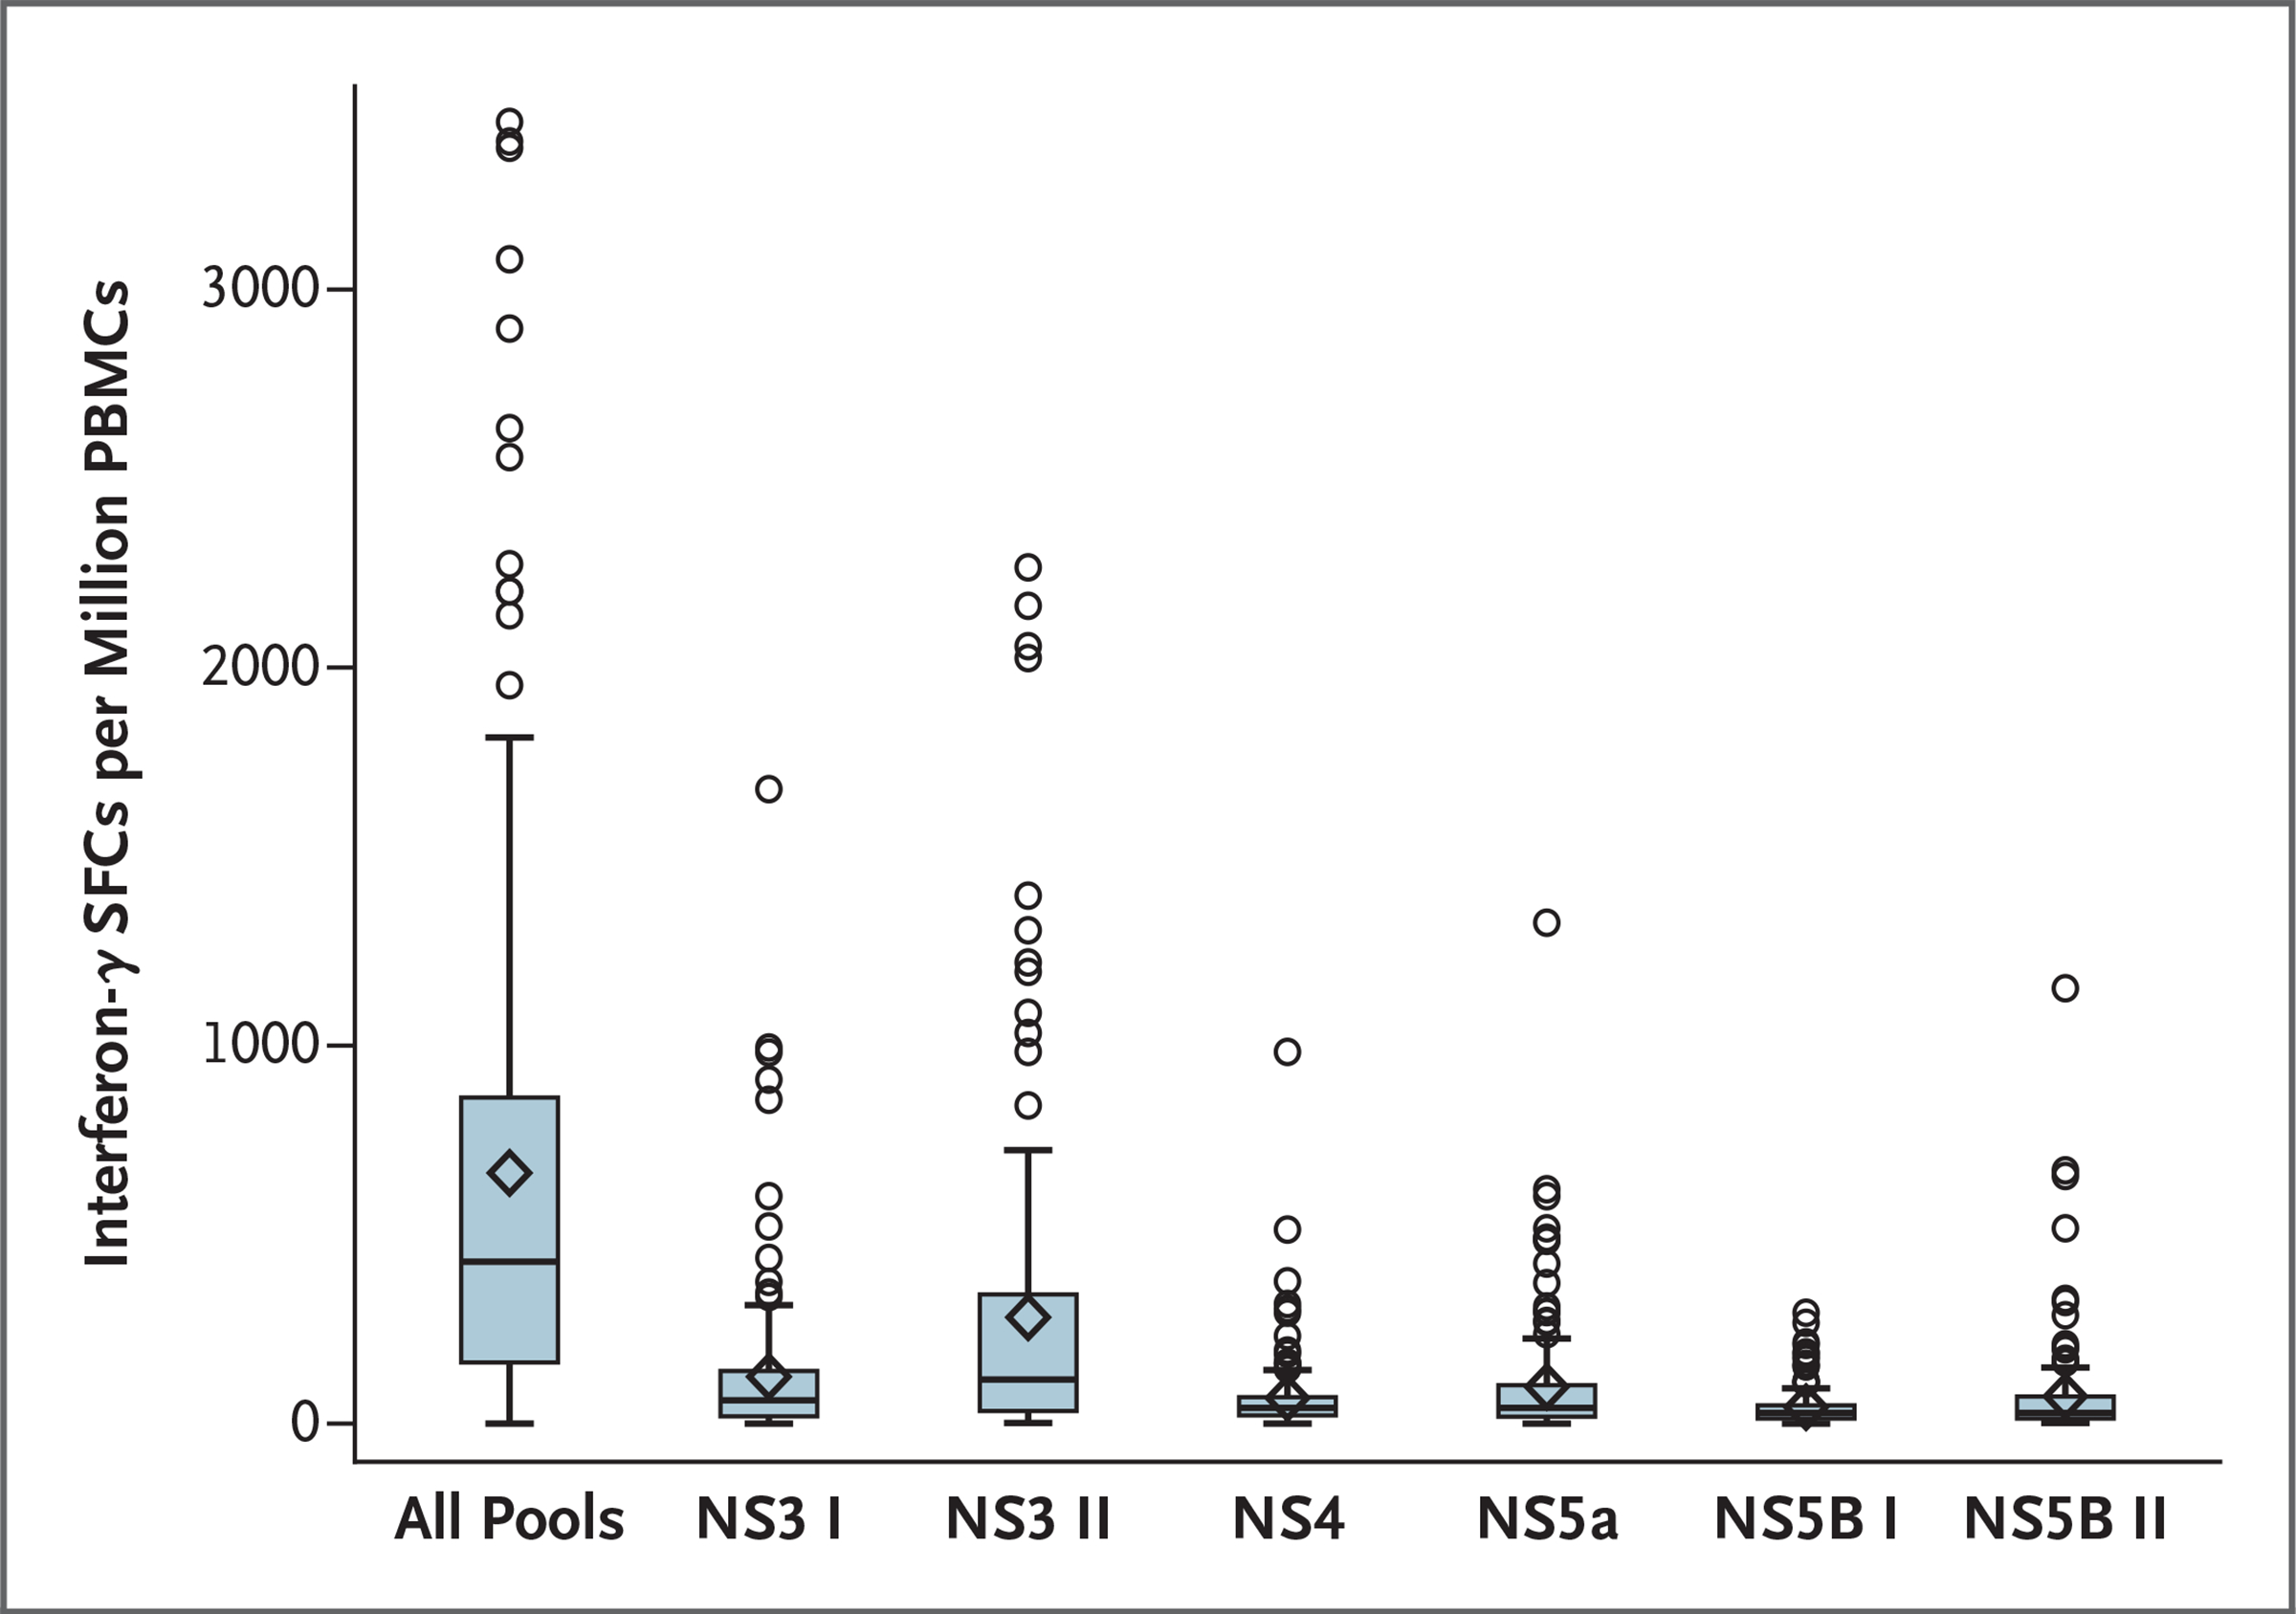
Figure 1. Peak Vaccine-Induced T-Cell Responses in the Vaccine Group.

Peak responses (at 1 week after the MVA-NSmut injection) were assessed by inteferon-γ enzyme-linked immunosorbent spot assay according to nonstructural (NS) protein pool. In the box-and-whisker plots, the horizontal line indicates the median, the top and bottom of the box the interquartile range, the diamond the mean, and the whiskers the 95% confidence interval. PBMC denotes peripheral blood mononuclear cell, and SFC spot-forming cell.
